Visuals

Treemap

Also called: Tree map, Treemap chart

A treemap splits a rectangle into smaller rectangles sized by value, such as revenue by product, to show how a total breaks down. Nested rectangles show a hierarchy.
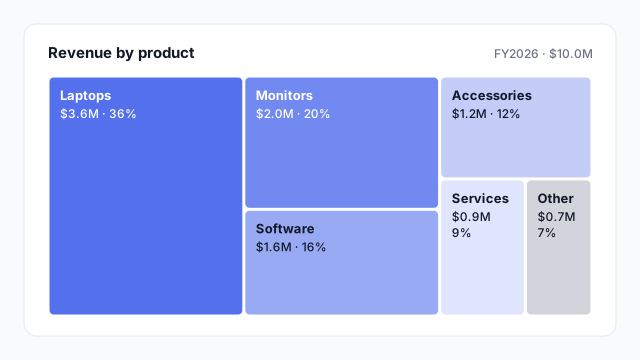
Treemap of $10.0M revenue by product: Laptops $3.6M (36%), Monitors $2.0M (20%), Software $1.6M (16%), Accessories $1.2M (12%), Services $0.9M (9%) and Other $0.7M (7%).

How to read a treemap

The whole rectangle is the total, here $10.0M of revenue. Each smaller rectangle is one part, and its area is its share: Laptops takes up 36% of the space because it’s 36% of revenue.

Most tools lay the rectangles out largest first, starting in one corner, and try to keep them close to square so they’re easier to compare. Ben Shneiderman introduced treemaps around 1990 to show disk usage, and the idea carried straight over to business data.

Nested treemaps

A treemap’s real strength is hierarchy. Put rectangles inside rectangles and you see both levels at once.
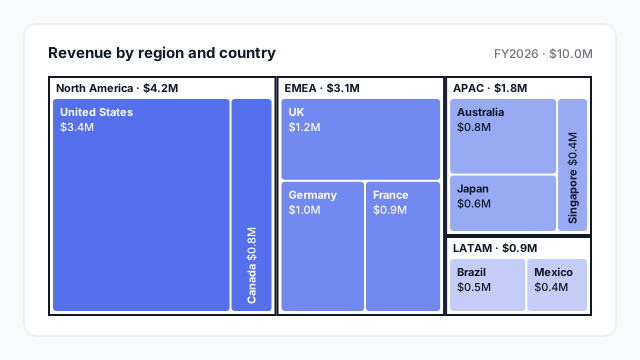
Two-level treemap of $10.0M revenue: North America $4.2M (US $3.4M, Canada $0.8M), EMEA $3.1M (UK $1.2M, Germany $1.0M, France $0.9M), APAC $1.8M (Australia $0.8M, Japan $0.6M, Singapore $0.4M), LATAM $0.9M (Brazil $0.5M, Mexico $0.4M)

Here you can see that North America is the biggest region and that most of it is one country, while EMEA is spread evenly across three.

Common uses

Ordered from most to least common.

  1. Revenue or sales by product or category, often nested (category → product).
  2. Spend by department or cost centre, where finance wants to see the big buckets and what’s in them.
  3. Revenue by geography, region → country, as above.
  4. Share of anything with many parts: support tickets by topic, traffic by page, storage by folder.

In Power BI vs. Tableau

Power BITableau
Built-inTreemapTreemap in Show Me
SizeValues fieldMeasure on Size
NestingCategory + Details fields, with drill-downMore than one dimension on the Marks card

Best practices

  • Label the big rectangles with name, value and share. Let the small ones go unlabelled and rely on tooltips.
  • Use one colour family, darker for bigger or for the parent group, and grey for “Other”.
  • Group the tail into “Other” so thin slivers don’t clutter the edge.
  • Don’t use it for change over time. Rectangles shift position between periods, so readers can’t track them. Use stacked columns instead.
  • Avoid negative values. Area can’t be negative, so losses or refunds won’t show.

Mocking up a treemap

Treemaps get awkward fast in a short, wide dashboard slot: the small rectangles collapse into slivers. Try it at its real size on a mockup and decide which levels to show before you build.

Related terms

Common questions

When should I use a treemap instead of a pie or donut chart?
When there are more than about five parts, or when the parts have sub-parts. A donut gets unreadable past five slices; a treemap can show dozens of rectangles and nest them, such as countries inside regions.
Does Power BI have a treemap?
Yes. Treemap is a built-in Power BI visual with Category, Details and Values fields. Tableau also offers a treemap in Show Me.
What are the downsides of a treemap?
It's hard to compare rectangles of similar size, or ones that aren't next to each other, because people judge area less accurately than length. If precise comparison matters, use a sorted bar chart.

Mock it up before you build it

Lay out your Power BI or Tableau dashboard in Mockko, get sign-off, then build. Free to start.

Try Mockko free