How the two patterns work
Both patterns start from the same fact: in left-to-right languages, people start reading a screen at the top left. They differ in what happens next.
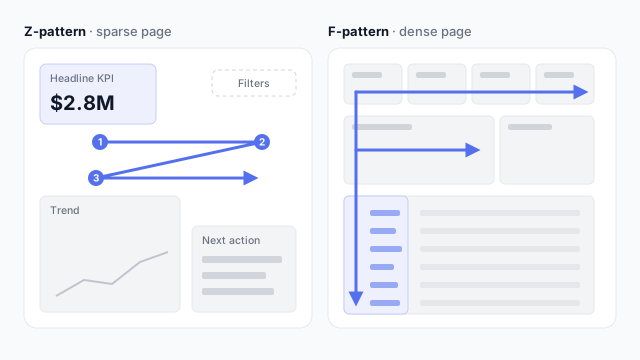
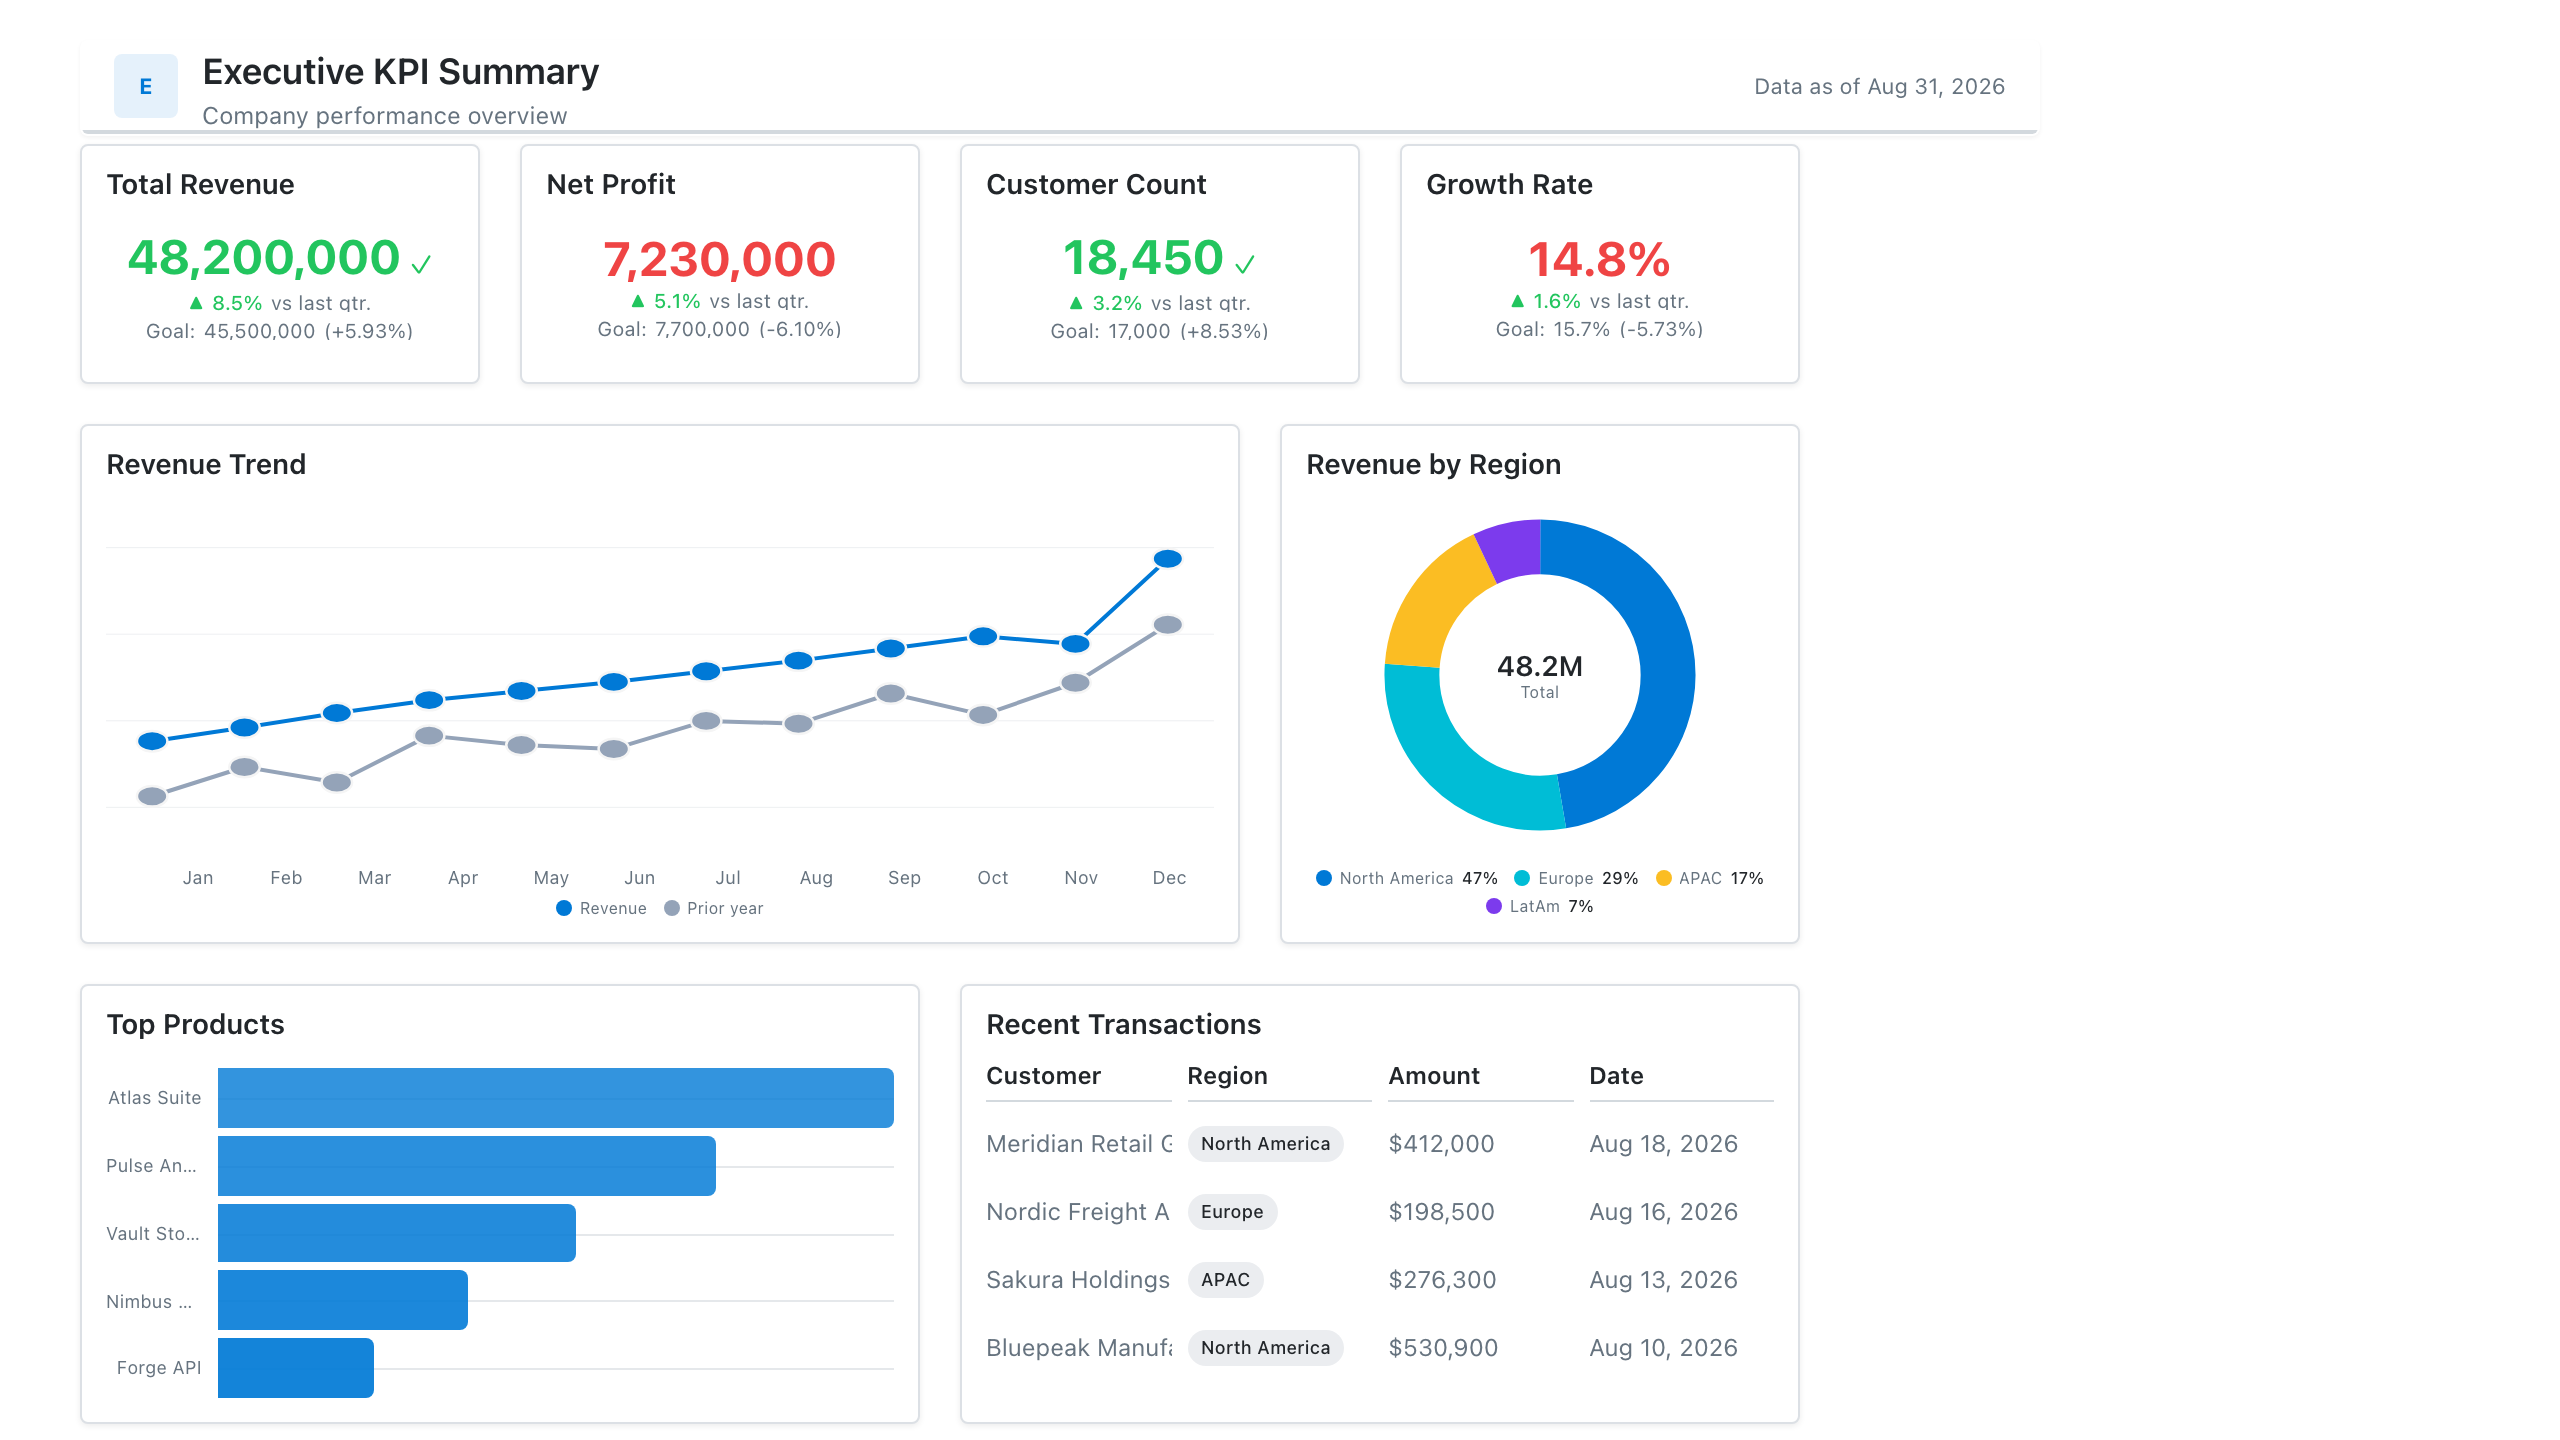
Z-pattern (sparse pages). The eye goes across the top, cuts diagonally down to the bottom left, then across the bottom. The four stops are the four corners, so that’s where the four most important things go. It suits pages with only a handful of elements, such as an executive dashboard.
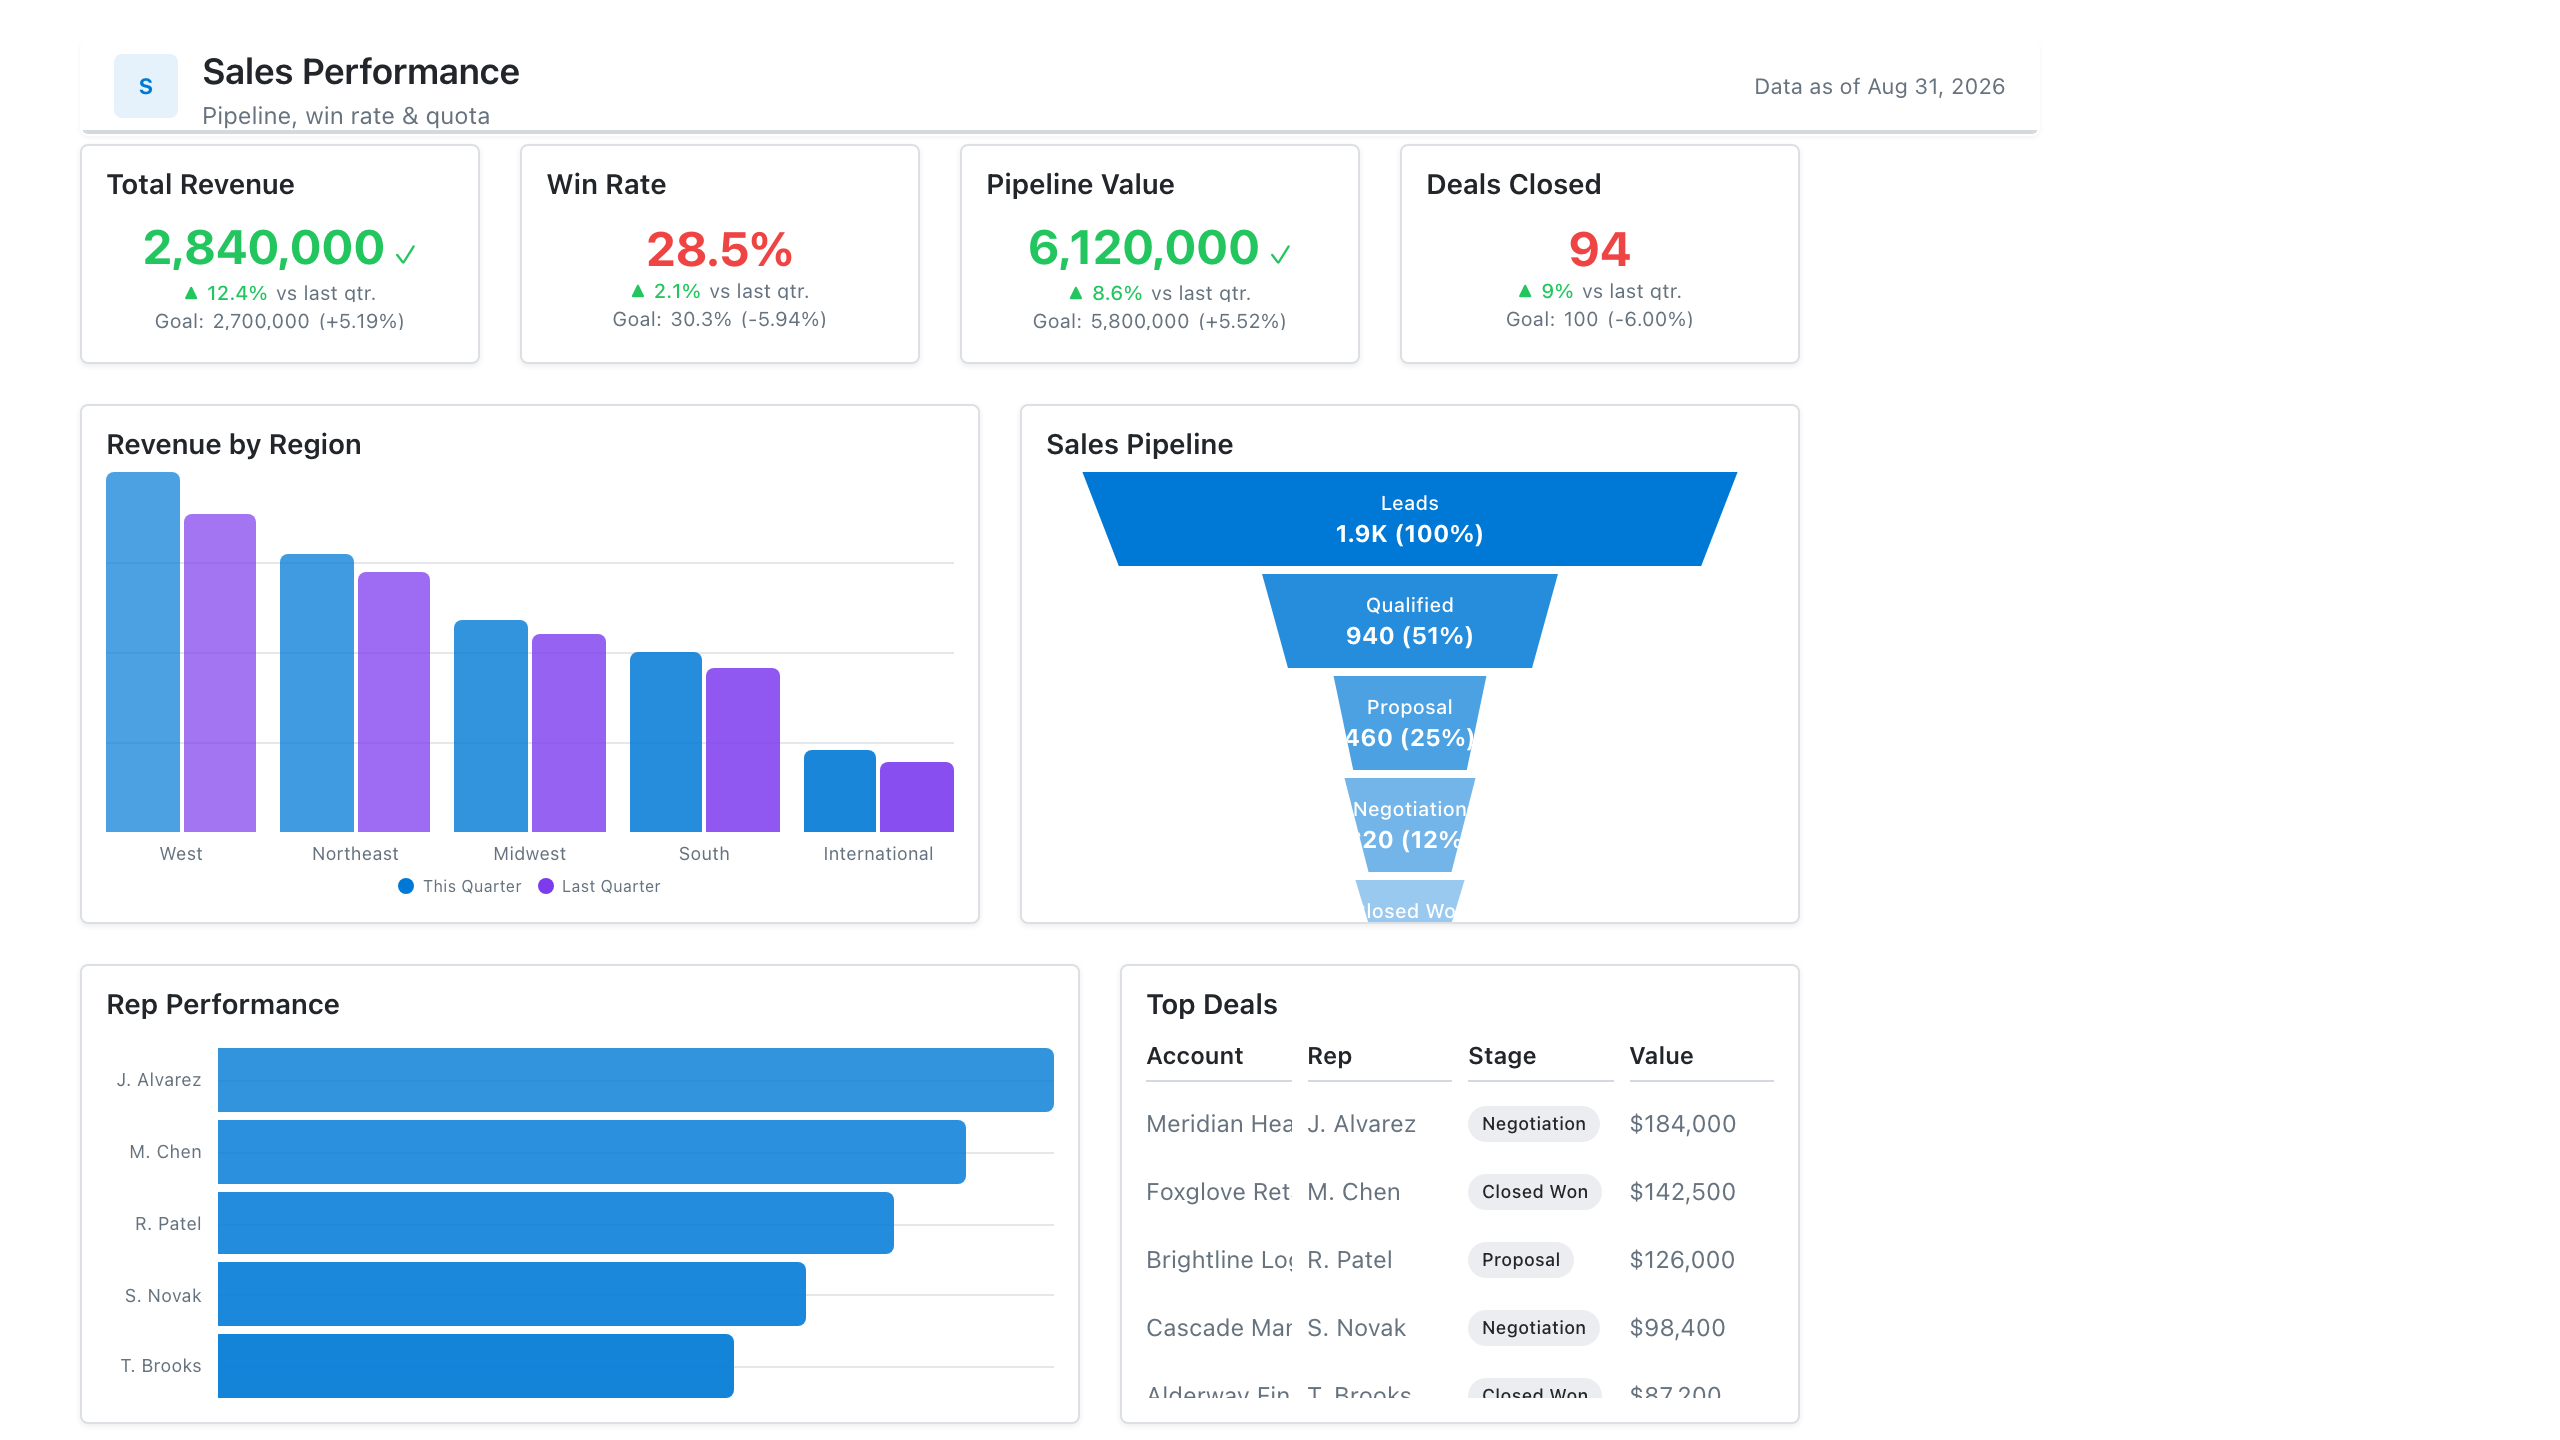
F-pattern (dense pages). The eye reads across the top row, makes a shorter sweep across a second row, then scans down the left edge, reading only the start of each line. The name comes from eye-tracking research by the Nielsen Norman Group on text-heavy web pages. It suits dashboards with many KPIs, long tables or matrices.
What goes where
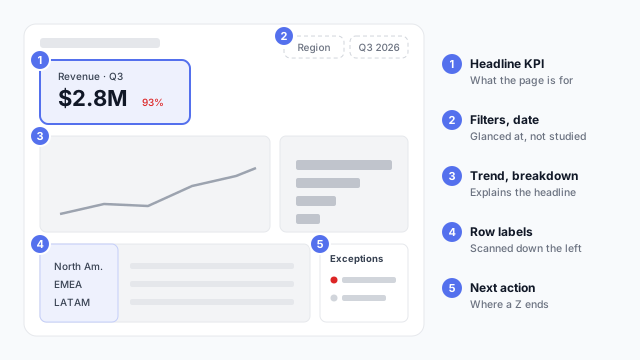
- Top left: the headline. The number the page exists for. Both patterns agree on this.
- Top right: context. Date range, filters, last refresh time. Readers glance at it but don’t dwell.
- Middle: the explanation. Trend and breakdown charts that explain the headline.
- Left column: labels worth scanning. In an F-pattern, readers skim the left edge, so start rows and bullet points with the word that matters: “LATAM: 73% of target”, not “Target achievement for LATAM”.
- Bottom right: what’s next. A Z ends here, so it’s a natural spot for exceptions, a call to action or a link to detail.
Choosing between them
| Z-pattern | F-pattern |
|---|
| Page density | Sparse, 4–6 elements | Dense, many KPIs or rows |
| Typical page | Executive summary, landing page | Operational report, detail page |
| Reader | Glances for the headline | Scans for a specific row or metric |
| Design focus | The four corners | The top rows and the left edge |
Best practices
- Put the most important item top left. It’s the one rule that holds for both patterns.
- Don’t fight the pattern with colour. A bright element bottom right can pull the eye there first. Use visual hierarchy to reinforce the reading order, not to scramble it.
- Front-load labels. In F-pattern pages, the first two or three words of every label and row do most of the work.
- Mirror it for right-to-left languages. Arabic and Hebrew readers start top right, so the patterns flip.
- Treat it as a starting point. These patterns describe default scanning. A clear hierarchy, with one obvious headline, matters more than following the letter exactly.
Mocking up the layout
Layout patterns are cheapest to test on a wireframe or mockup: show it to someone for five seconds and ask what they noticed first. Our dashboard wireframe best practices cover leading with the answer and placing filters.