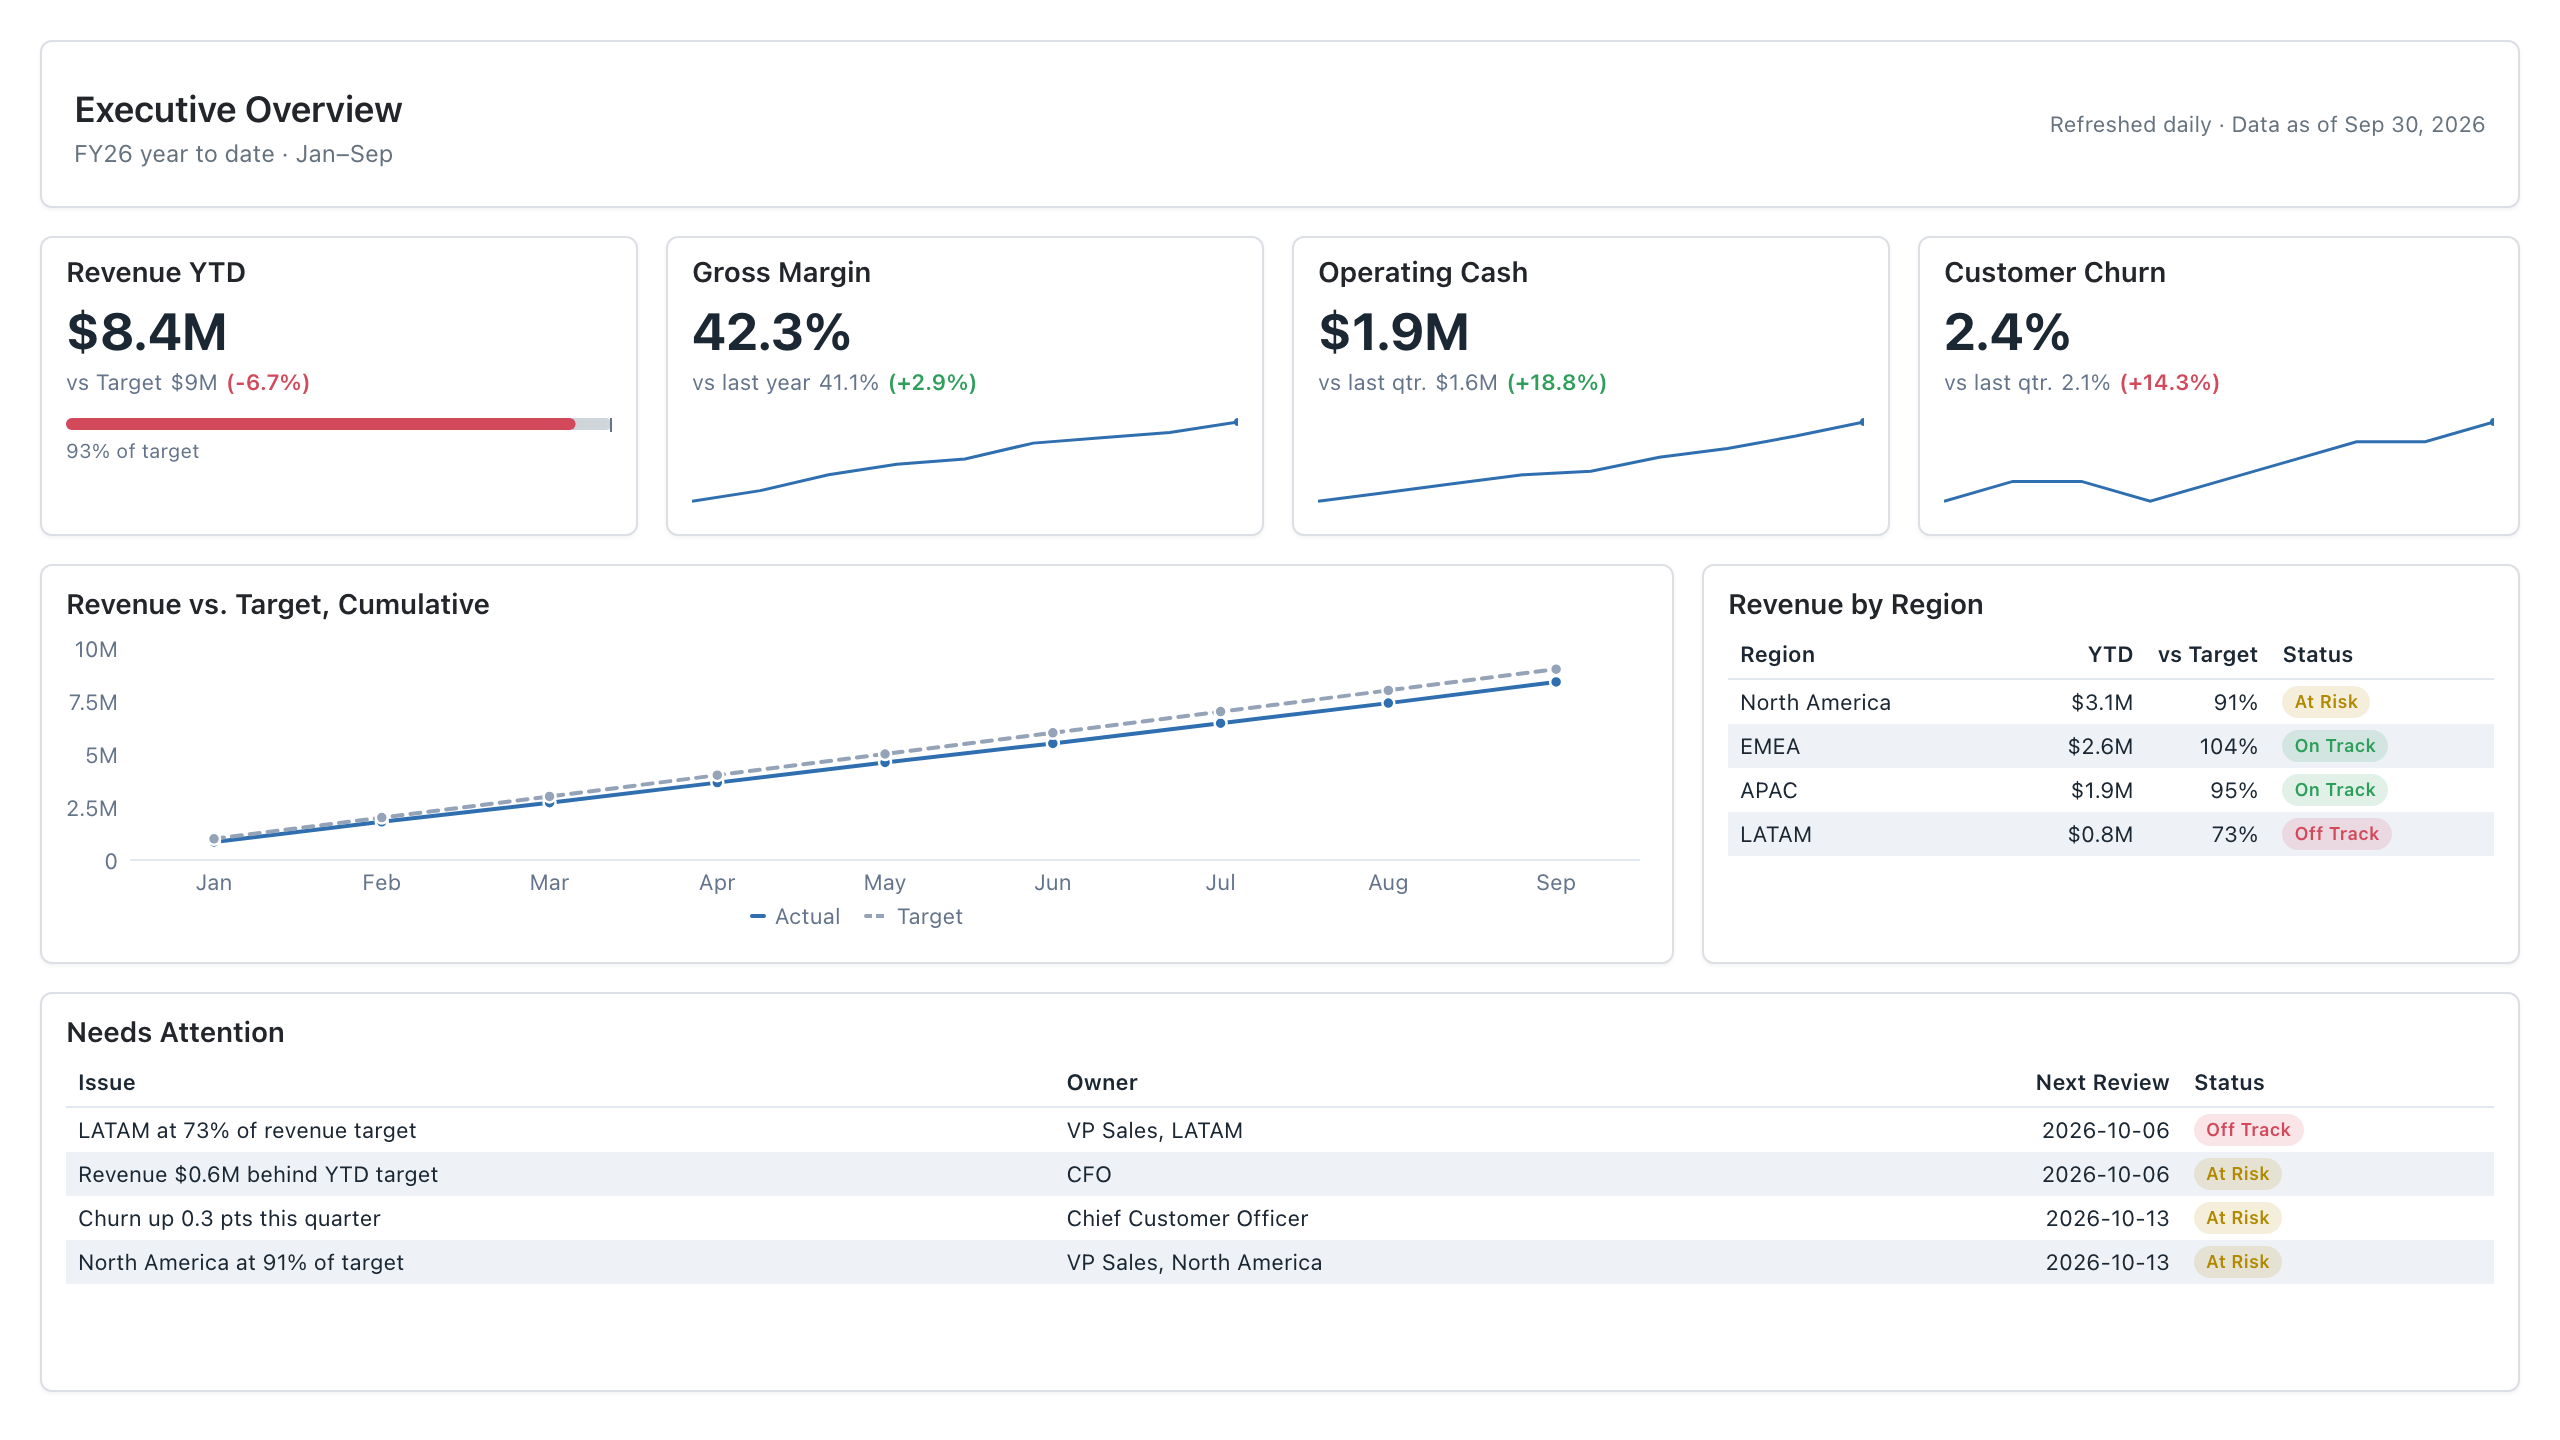
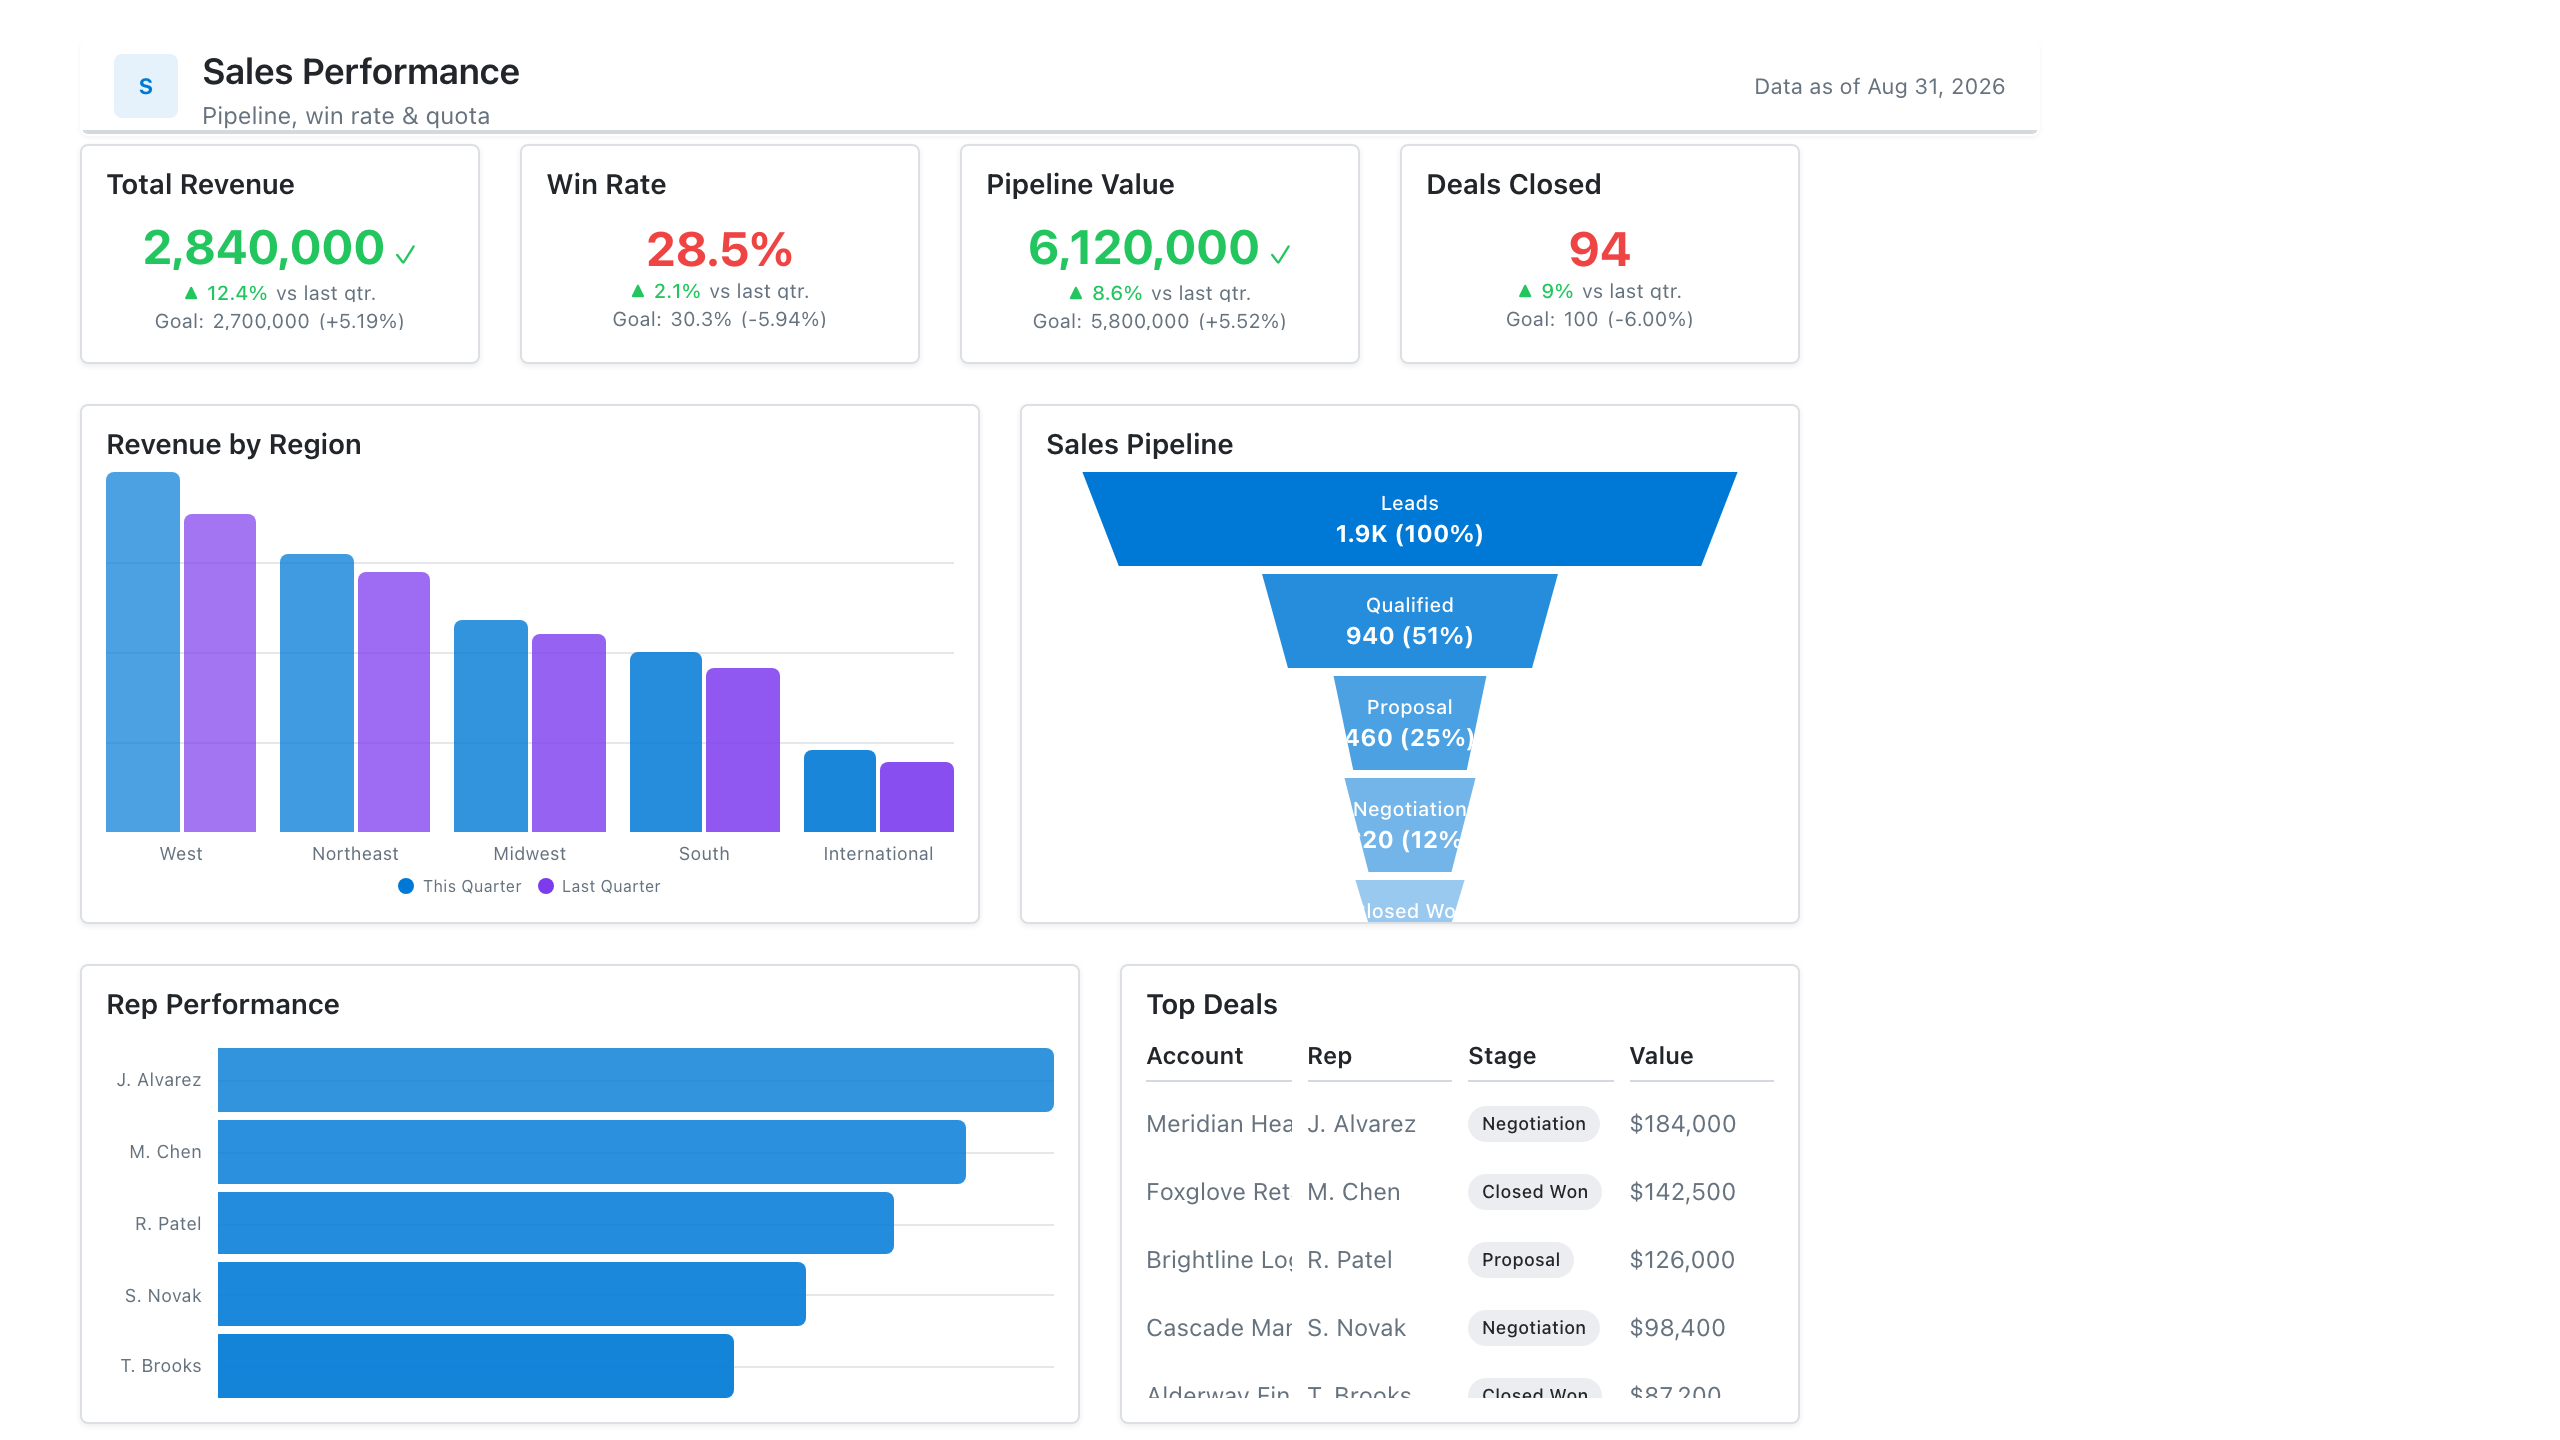
Visual Hierarchy
Also called: Information hierarchy, Dashboard hierarchy
Visual hierarchy is the arrangement of a dashboard's elements by size, position, colour and spacing so readers see the most important information first and the details last.
Also called: Information hierarchy, Dashboard hierarchy
Visual hierarchy is the arrangement of a dashboard's elements by size, position, colour and spacing so readers see the most important information first and the details last.
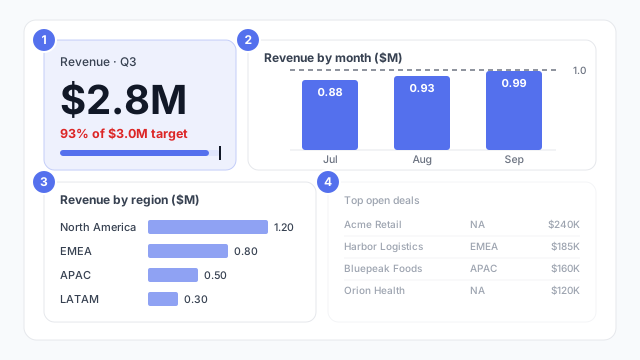
Every dashboard has a reading order, whether you design it or not. Visual hierarchy is designing it on purpose.
In the example, the order is numbered:
Each step down the order gets less size, a lower position or a quieter colour. That’s the whole technique.
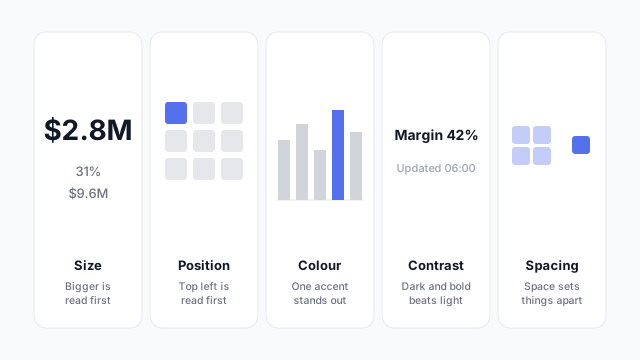
Hierarchy works at two levels. Across the page: headline KPIs, then trends, then breakdowns, then detail, as in an executive dashboard. Inside each visual: in a KPI card, the value is biggest, the comparison is smaller, and the label is smallest and greyest.
Hierarchy is a layout decision, so it’s cheapest to get right on a mockup, before anyone has formatted a visual. Our dashboard wireframe best practices cover leading with the answer and choosing one hero visual.
These free Mockko templates use it. Open one and edit it in your browser.
Lay out your Power BI or Tableau dashboard in Mockko, get sign-off, then build. Free to start.
Try Mockko free