What the requirements cover
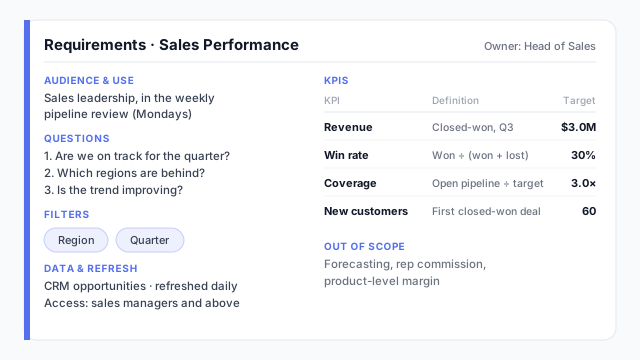
Good requirements fit on one page. The example covers the six things a developer needs before designing anything:
- Audience and use. Sales leadership, in the weekly pipeline review. This decides how dense the page can be and how often it needs to refresh.
- Questions. Three plain-language questions the page must answer. Everything on the dashboard should trace back to one of them.
- KPIs with definitions and targets. “Revenue” isn’t a requirement. “Closed-won revenue, by close date, against a $3.0M quarterly target” is.
- Filters. Region and quarter. Each filter is a promise that every visual still makes sense when it’s applied.
- Data sources. Where each number comes from, and who owns that source.
- Refresh and access. How fresh the data must be and who can see it.
From questions to visuals
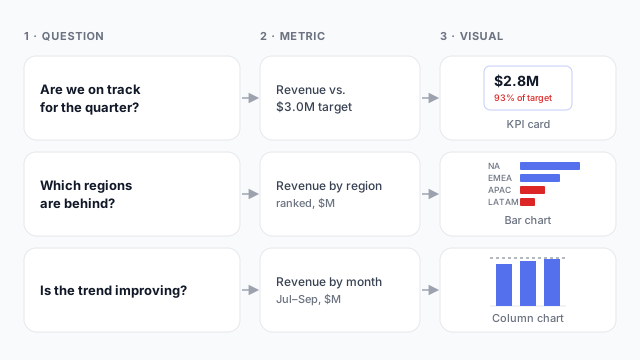
The most useful habit in requirements gathering is to write the question first, then the metric that answers it, then the visual. It stops two common problems: charts nobody asked for, and questions nobody answered.
If a stakeholder asks for a specific chart (“we need a pie chart of regions”), ask what they’d decide from it. The answer is the real requirement, and it may be better served by a different visual.
Functional and non-functional requirements
| Functional (what it shows and does) | Non-functional (how it runs) |
|---|
| KPIs, definitions and targets | Data refresh frequency |
| Visuals and the questions they answer | Who can access it, and row-level restrictions |
| Filters, drill-downs, navigation | Performance (how fast pages must load) |
| Export or subscription needs | Devices: desktop, mobile, wall screen |
Non-functional requirements are easy to forget in a workshop and expensive to discover after launch, especially access rules and refresh times.
Best practices
- Talk about decisions, not charts. “What would you do differently if this number dropped?” gets better requirements than “what charts do you want?”
- Define every KPI in writing. Include the filter logic, time frame and target. Two teams often calculate “active customer” differently.
- Keep the question list short. Three to five per page. More than that is usually two dashboards for two audiences.
- Turn requirements into a mockup quickly. People find it much easier to react to a picture than to approve a list.
- Record what’s out of scope. It’s the easiest way to stop the dashboard growing during the build.
Mocking up the requirements
A requirements list becomes real when stakeholders see it as a dashboard mockup, and that’s usually when the missing requirements surface. Our guide to mocking up a Power BI dashboard before you build it starts with that requirements conversation.