What a mockup shows
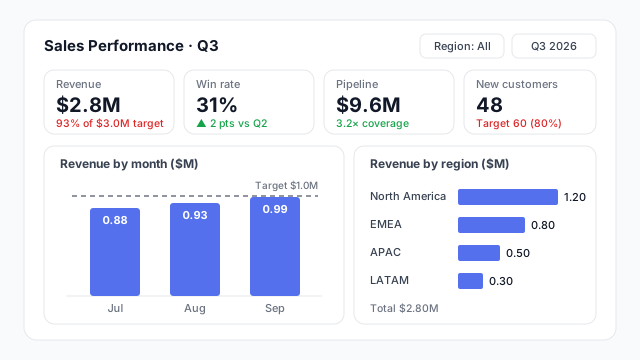
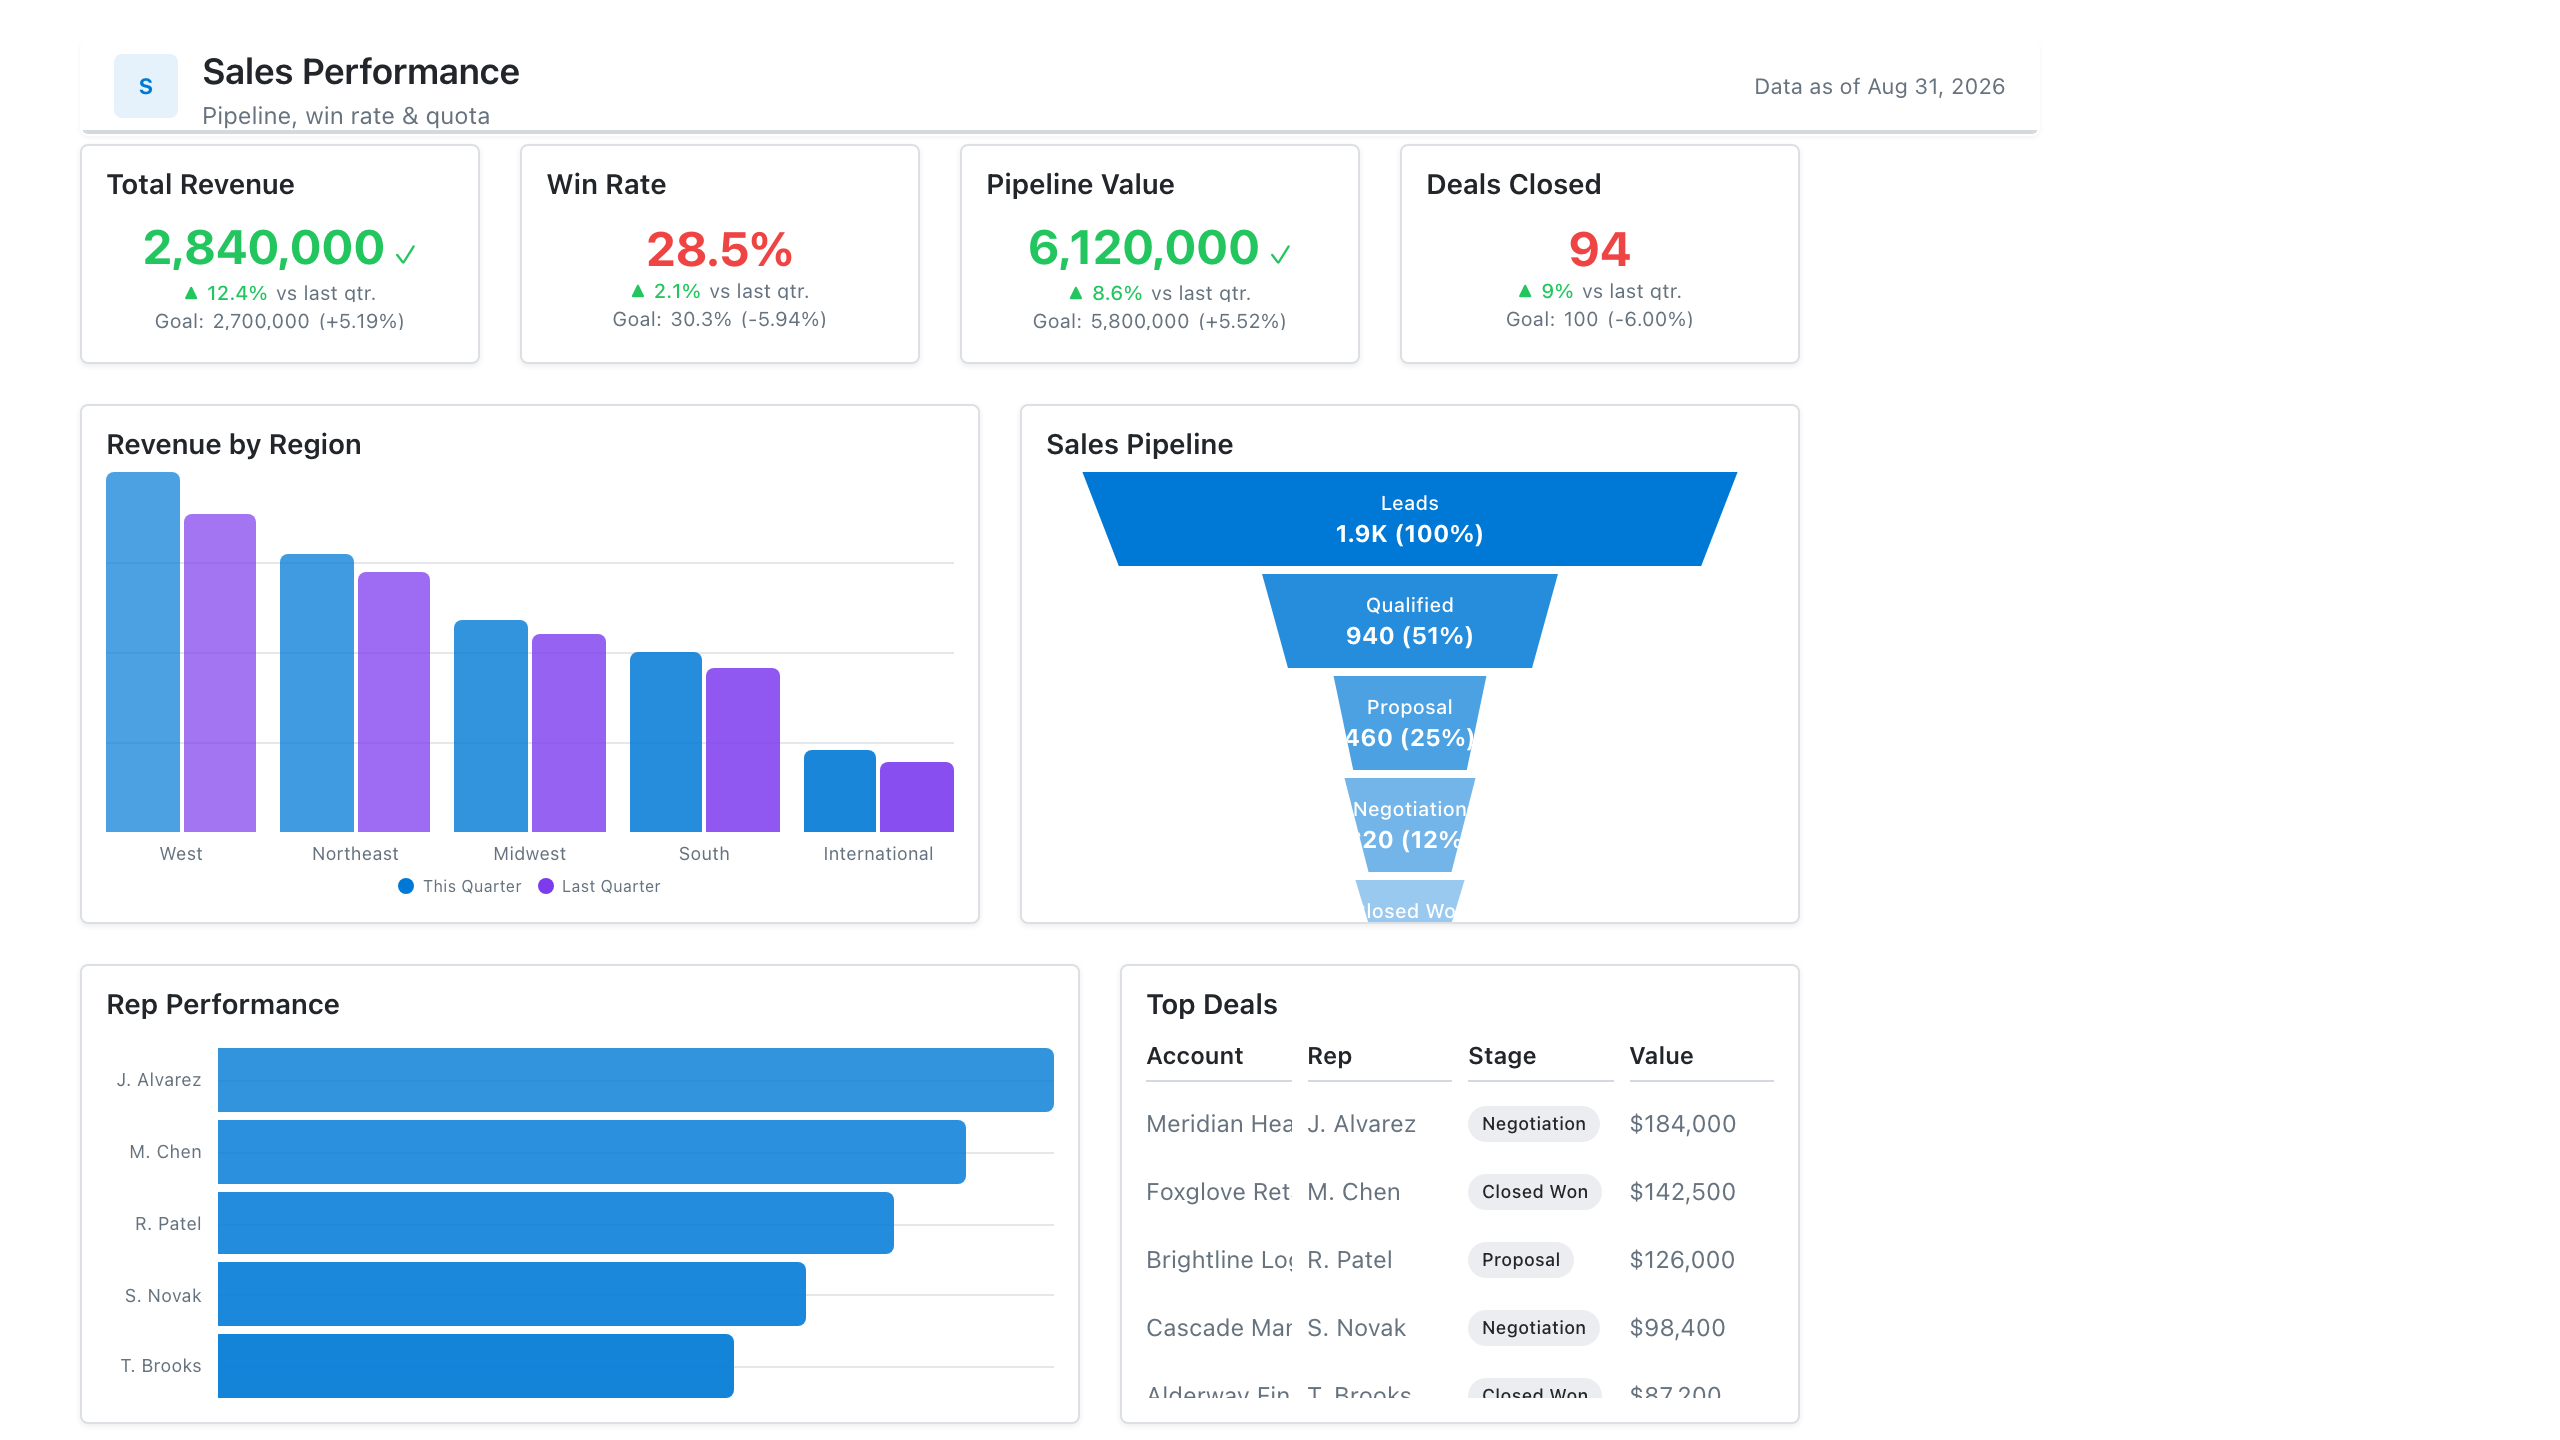
A mockup is the dashboard as it will look, minus the live data. Every box from the wireframe becomes a specific visual with a title, axis labels, colours and sample values.
The example is a Q3 sales page. It shows the decisions a stakeholder can now react to:
- Which KPIs, and against what. Revenue is shown against a $3.0M target (93%), new customers against 60. Win rate is compared with last quarter instead, which is a choice someone should confirm.
- Which chart types. Monthly revenue as columns with a $1.0M-a-month target line, regions as a ranked bar chart.
- How the numbers read. The three months ($0.88M + $0.93M + $0.99M) and the four regions ($1.20M + $0.80M + $0.50M + $0.30M) both add up to the $2.8M on the card. A mockup whose numbers don’t reconcile invites the wrong questions.
Nothing is connected to a database. That’s the point: changing a chart type or swapping a KPI takes seconds.
Where it fits in the process
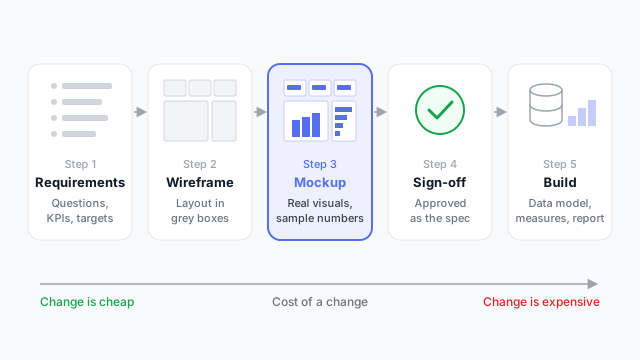
- Requirements. Who it’s for, the questions it answers, the KPIs and targets.
- Wireframe. Grey boxes to agree the layout.
- Mockup. Real visuals and sample numbers.
- Sign-off. The stakeholder approves the mockup as the spec.
- Build. Data model, measures and the real report.
Small or familiar dashboards often skip the wireframe and go straight to a mockup. See low vs. high fidelity for how polished each stage should be.
Mockup vs. wireframe vs. prototype
| Looks like | Settles |
|---|
| Wireframe | Grey boxes, no data | Layout |
| Mockup | Finished, with sample numbers | Content, chart types, look |
| Prototype | Finished, and clickable | How it behaves |
A prototype adds interaction: filters, clicks and navigation between pages.
For BI work, a mockup is usually where the most expensive misunderstandings get caught, because it’s the first point where a stakeholder sees their numbers in a specific chart.
Best practices
- Use the real canvas size. Build on the same proportions as the target report (16:9 is the Power BI default), so the layout survives the build.
- Use the real visual types. A chart that can’t be built in the target tool, or needs a custom visual, should be flagged now, not discovered later.
- Make the sample numbers add up. Totals, subtotals and percentages should reconcile. Use plausible magnitudes for the client’s business.
- Label everything as you would in the build. Titles, units and time frames (“Revenue (Q3, $M)”) are part of what’s being approved.
- Keep one version of the truth. Number versions (v1, v2, v3) and note what changed, so sign-off refers to a specific one.
Mocking up a dashboard
A mockup is the cheapest place to find out that a stakeholder wanted a different KPI, chart or filter. Our guide to mocking up a Power BI dashboard before you build it walks through the process step by step.