How it works
A drillthrough page is a normal report page with one extra setting: a field that it can be filtered by. Anywhere else in the report, a visual that uses that field gets a Drill through option in its right-click menu.
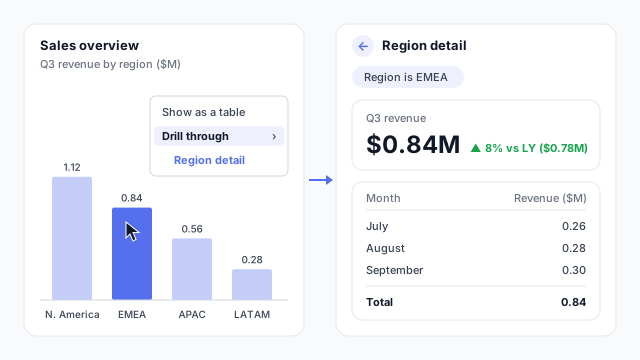
In the example, the Sales overview page shows Q3 revenue by region. The reader right-clicks EMEA and picks Drill through › Region detail. Power BI opens the Region detail page with the filter Region is EMEA applied:
- The headline: $0.84M of Q3 revenue, up 8% on last year’s $0.78M.
- The breakdown: July $0.26M, August $0.28M and September $0.30M, which add up to the $0.84M.
The same page works for every region. Right-click APAC and it shows APAC’s numbers instead, so you build one detail page rather than four.
Drill down vs. drill through
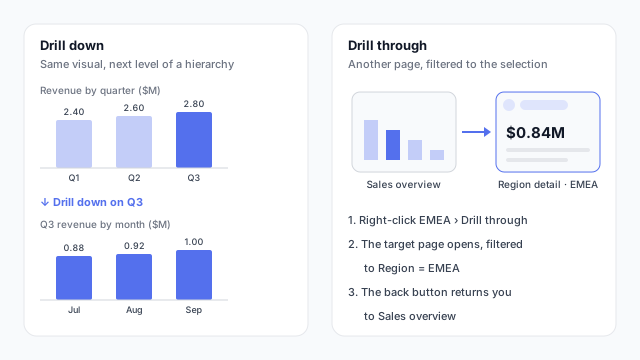
The two get confused because both mean “show me more about this”. Drill down moves down a hierarchy inside the same chart. Drill through moves to another page that was designed to answer a different question about the selected item: its trend, its top customers, its open issues.
Setting it up in Power BI
- Build the target page. Lay out the visuals for a single item, such as one region.
- Add the drillthrough field. With the page selected, drag Region into the Drill through well in the Visualizations pane. Power BI adds a back button to the page.
- Decide on filters. Keep all filters passes the source page’s other filters (slicers, date range) through as well. Turn it off if the detail page should only filter by the drillthrough field.
- Make it findable. Right-click menus are easy to miss, so many reports also add a button with the Drill through action.
Drillthrough works from charts, tables and matrix visuals, so a reader can jump from any row of a summary table to its detail page.
Best practices
- One question per target page. “Everything about EMEA” turns into a second overview. Pick the follow-up question readers actually ask.
- Show the filter. Put the selected item in the page title or a card so readers know what they’re looking at.
- Tell readers it’s there. Add a hint such as “Right-click a region for detail”, or a drillthrough button.
- Use a tooltip page for quick answers. If readers only need a glance, a tooltip page answers on hover, without leaving the page.
- Hide target pages if they don’t stand alone. A detail page with no filter applied shows totals that can confuse readers who land on it from the page tabs.
Mocking up drillthrough
Drillthrough pages are where a report’s navigation lives, so sketch the overview and each detail page side by side and agree which fields lead where before anyone builds the model. See why to mock up Power BI reports before you build.