Power BI

Tooltip Page

Also called: Report page tooltip, Custom tooltip, Viz in Tooltip (Tableau)

A tooltip page is a small Power BI report page that appears when you hover over a data point, filtered to that point, so a tooltip can show charts and KPIs instead of a list of values.

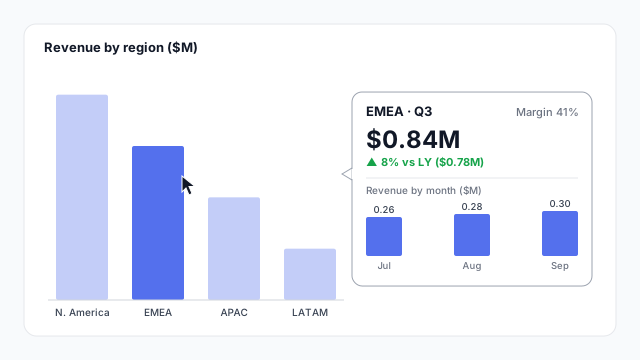
A revenue by region column chart with the cursor on EMEA and a tooltip page open beside it, filtered to EMEA: $0.84M in Q3, up 8% on last year's $0.78M, margin 41%, and monthly revenue of $0.26M, $0.28M and $0.30M for July to September.

How it looks in each tool

Same idea, different name. Here's the tooltip page (or its equivalent) in each BI tool.

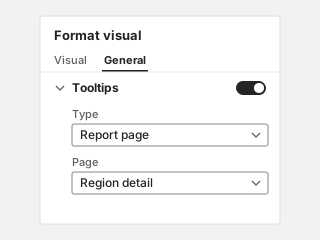
Power BI Format visual pane, General tab, with Tooltips turned on, Type set to Report page and Page set to Region detail.
Power BI Report page tooltip A separate page set to the Tooltip size and assigned to visuals.
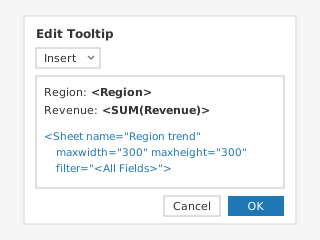
Tableau Edit Tooltip dialog with Region and Revenue fields and an inserted Sheet tag for the Region trend sheet, with a maximum size of 300 by 300 and filtered by all fields.
Tableau Viz in Tooltip A worksheet embedded in the tooltip text, filtered to the hovered mark.

Illustrations, not screenshots. Product names are trademarks of their owners.

How it works

A default tooltip shows the numbers behind one data point. A tooltip page shows the context around it.

In the example, the main chart shows revenue by region. Hovering over EMEA opens a small page filtered to EMEA:

  • The value and its comparison: $0.84M in Q3, up 8% on last year’s $0.78M.
  • A second measure: margin, 41%.
  • The breakdown: revenue by month, $0.26M, $0.28M and $0.30M, which add up to the $0.84M.

The tooltip page itself is built like any report page, with its own KPI cards and charts. Power BI filters it to whatever the reader is hovering over.

Default tooltip vs. tooltip page
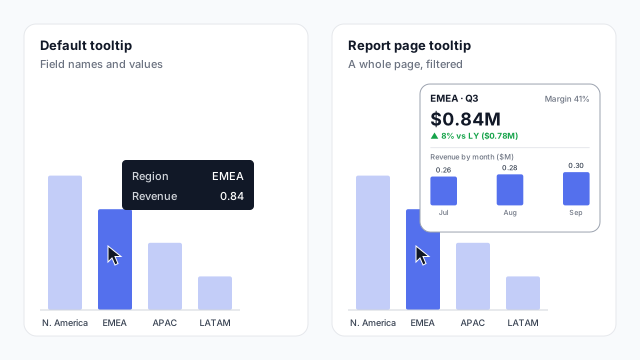
Two tooltips for the same EMEA column. Left, the default tooltip lists Region EMEA and Revenue 0.84. Right, a tooltip page shows a small filtered page with $0.84M, up 8% on last year, margin 41%, and revenue by month

Use a tooltip page when the question after “how much?” is always the same, such as “what’s the trend?” or “how does it compare with last year?”. It answers that question without a click, a new page or another chart taking up space on the canvas.

Setting one up in Power BI

  1. Create the page. Add a page, turn on Allow use as tooltip, and set the canvas size to Tooltip (320 × 240) or a custom small size.
  2. Build it small. One headline number, one comparison and one small chart is plenty.
  3. Assign it. On each chart, set Tooltips > Type to Report page and pick the page.
  4. Hide it. Hide the page so readers don’t land on it as a normal page.

Tooltip pages work on charts, matrix visuals and tables, so hovering a row or cell can show the detail behind it.

Best practices

  • Keep it glanceable. It disappears when the cursor moves, so it has a second or two to make its point.
  • Answer the next question. Show what readers would otherwise click through to find, not a copy of what’s already on the page.
  • Use the same styling. Match the main report’s colours and KPI card design so it reads as part of the page.
  • Mind touch screens. Hover doesn’t exist on a phone or tablet, so don’t put anything essential only in a tooltip.

Mocking up tooltip pages

Tooltip pages are easy to forget in a spec, so sketch them next to the page they belong to and agree what they show at the mockup stage. Mockko has a Power BI Tooltip canvas preset for exactly this. See why to mock up Power BI reports before you build.
See it in a real layout

These free Mockko templates use it. Open one and edit it in your browser.

Related terms

Common questions

How do I create a tooltip page in Power BI?
Add a new page, turn on Allow use as tooltip in its page information settings, and set Canvas settings > Type to Tooltip (320 × 240). Build the visuals on it, then select a chart and, under Format visual > General > Tooltips, set Type to Report page and pick your page.
What's the difference between a tooltip and a tooltip page?
A default tooltip lists the field names and values for the data point you hover over. A tooltip page shows a whole small report page in its place, with its own visuals, filtered to that data point.
Does Tableau have tooltip pages?
The equivalent is Viz in Tooltip. You insert a worksheet into a mark's tooltip text, and Tableau shows it filtered to the hovered mark.

Mock it up before you build it

Lay out your Power BI or Tableau dashboard in Mockko, get sign-off, then build. Free to start.

Try Mockko free