What a Gantt chart shows
A Gantt chart puts time on the horizontal axis and tasks down the side. Each task is a bar: it starts at the task’s start date, runs for its duration, and ends at its finish date. It is named after Henry Gantt, an American engineer who popularised the format in the early twentieth century.
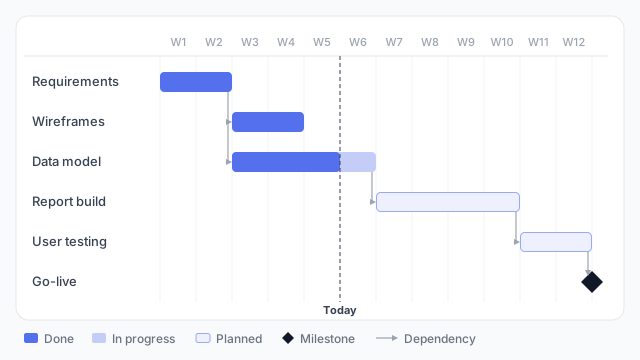
Reading the example above:
- Overlap is visible. Wireframes and the data model both start in week 3, so two people can work at once.
- Dependencies are arrows. The report build can’t start until the data model is done, so it begins exactly where the data model ends.
- A milestone is a point, not a bar. Go-live has no duration, so it’s drawn as a diamond.
- A “today” line splits finished work from work still ahead. Here the data model is 75% done: three of its four weeks are filled in.
What data it needs
Each row is a task with a start date and a duration (or end date). That’s enough for a basic chart. Add a status, percent complete, owner or predecessor column and you can colour, label and connect bars.
Common uses
Most common first:
- Project plans. The classic use: tasks, order and deadlines for a delivery, such as a dashboard build.
- Planned vs. actual. Draw the baseline plan and the real dates together, so slippage is obvious.
- Release and roadmap views. Features or campaigns across quarters, usually with fewer, longer bars.
- Resource and schedule views. One row per person or team, with bars for their bookings.
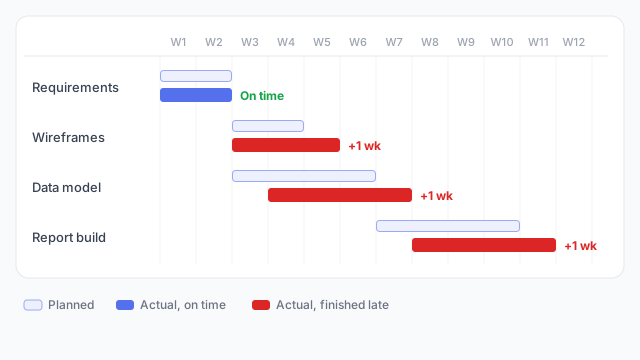
In the planned-vs-actual view, the data model started a week late and the report build waited for it, so the delay carried through to the end. Red marks finishing late. A cost going over is red for the same reason: colour follows meaning.
Where it goes on a dashboard
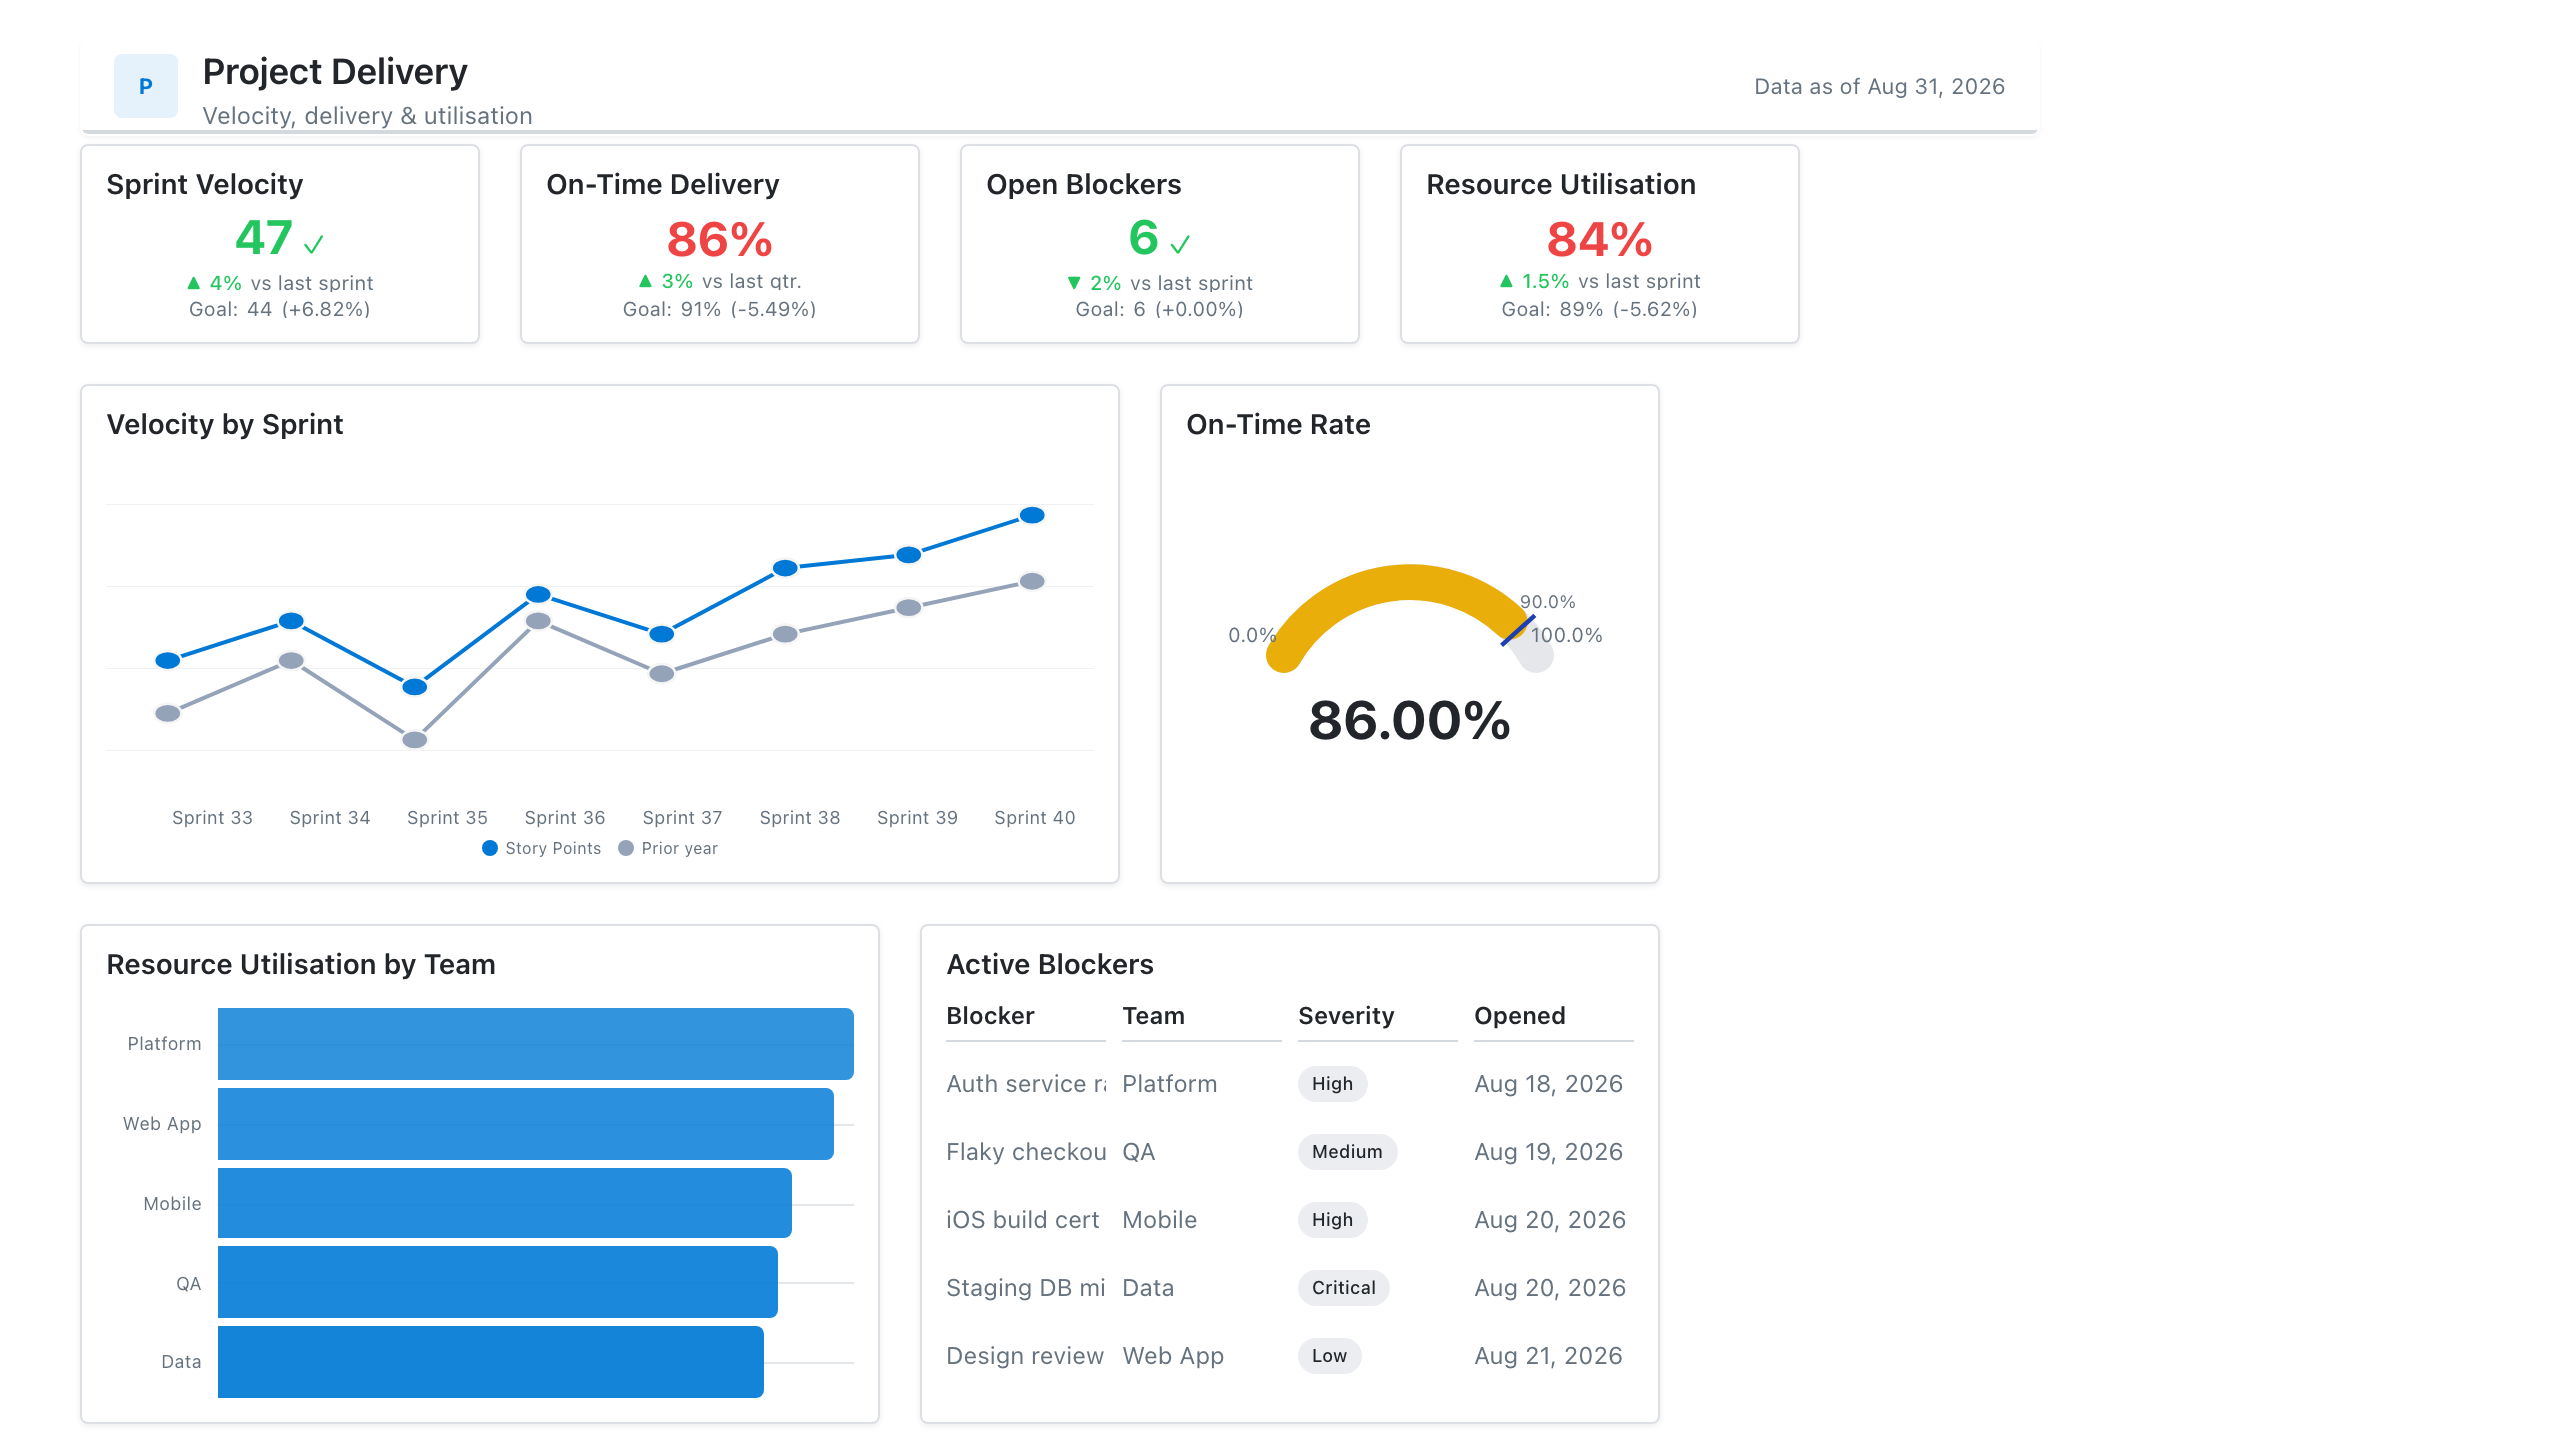
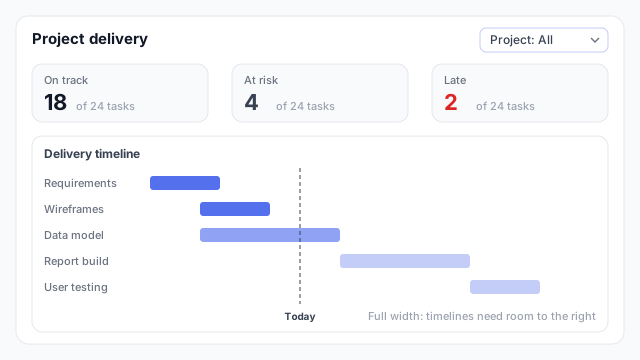
Give the Gantt chart the full width of the page, usually at the bottom, with KPI cards above it summarising the counts (how many tasks are on track, at risk and late). Timelines need room to the right, and a squeezed chart makes short tasks unreadable.
In Power BI vs. Tableau
| Power BI | Tableau |
|---|
| Built in? | No built-in Gantt visual | Yes, the Gantt Bar mark type |
| How you get one | A Gantt custom visual from AppSource | Start date on the axis, duration on Size |
Best practices
- Keep it to about 15–25 rows. Beyond that, group tasks into phases and let viewers expand them.
- Show today. A reference line is the quickest way to see what’s late.
- Limit the colours. Use one colour for the plan and one or two for status, rather than a colour per task.
- Sort by start date, so the chart reads as a staircase from top-left to bottom-right.
- Don’t use a Gantt chart for a handful of milestones. A simple dated list says it more clearly.
Mocking up a Gantt chart
A Gantt chart needs more canvas than most visuals, so settle its width and row count on the wireframe before building. That also tells you whether the data has the start and end dates the chart depends on.