How they differ
Both are written in DAX, and both show up in the field list, but they’re calculated at different times.
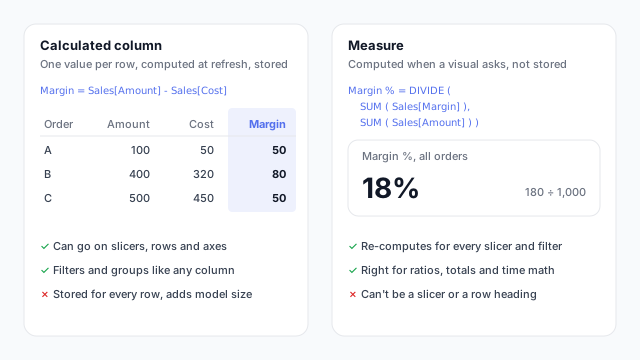
A calculated column is calculated once for every row when the semantic model refreshes, and the results are stored like any other column. In the example, Margin = Sales[Amount] - Sales[Cost] gives 50 for order A (100 − 50), 80 for order B (400 − 320) and 50 for order C (500 − 450).
A measure isn’t stored. It’s calculated each time a visual needs it, for the filters that visual applies. Margin % = DIVIDE ( SUM ( Sales[Margin] ), SUM ( Sales[Amount] ) ) gives 180 ÷ 1,000 = 18% for all three orders, and a different answer for each row of a region matrix.
| Calculated column | Measure |
|---|
| Calculated | At refresh, per row | At query time, per visual cell |
| Stored | Yes, adds to model size | No |
| Reacts to slicers | No, the value is fixed per row | Yes |
| Use on slicers, rows, axes | Yes | No |
| Good for | Categories, bands, flags, keys | Totals, ratios, comparisons |
The averaging trap
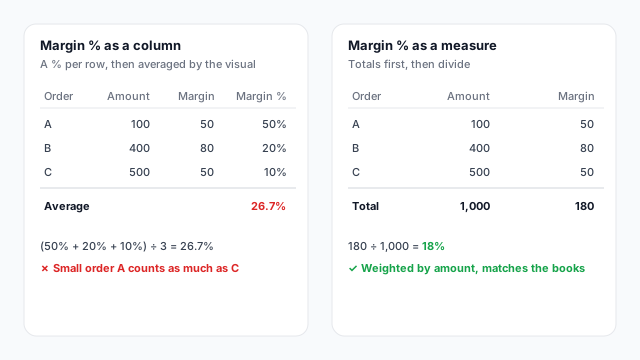
The most common mistake is putting a ratio in a calculated column. Order A’s margin is 50%, B’s is 20% and C’s is 10%. A visual that averages that column shows (50% + 20% + 10%) ÷ 3 = 26.7%, as if the $100 order counted as much as the $500 one.
The real margin is total margin divided by total amount: 180 ÷ 1,000 = 18%. Only a measure gets that right at every level, because it sums first and divides second, in each cell’s filter context.
A quick rule
- Will you slice, group or filter by it? Calculated column. Examples: “Order size band”, “Is weekend”, “Region group”.
- Will you add it up, compare it or divide it? Measure. Examples: Revenue, Margin %, YoY %, Running total.
- Can it be done before the model? Then consider doing it in Power Query or the source database instead, which keeps the model simpler.
Best practices
- Measures by default. Reach for a calculated column only when you need a row-level value to slice by.
- Never store a ratio in a column you’ll aggregate. Store the parts and divide in a measure.
- Watch the fact table. Calculated columns on millions of rows cost memory and refresh time.
- Name them so the difference shows. Some teams prefix columns or keep all measures in one measures table.
Mocking up measures and columns
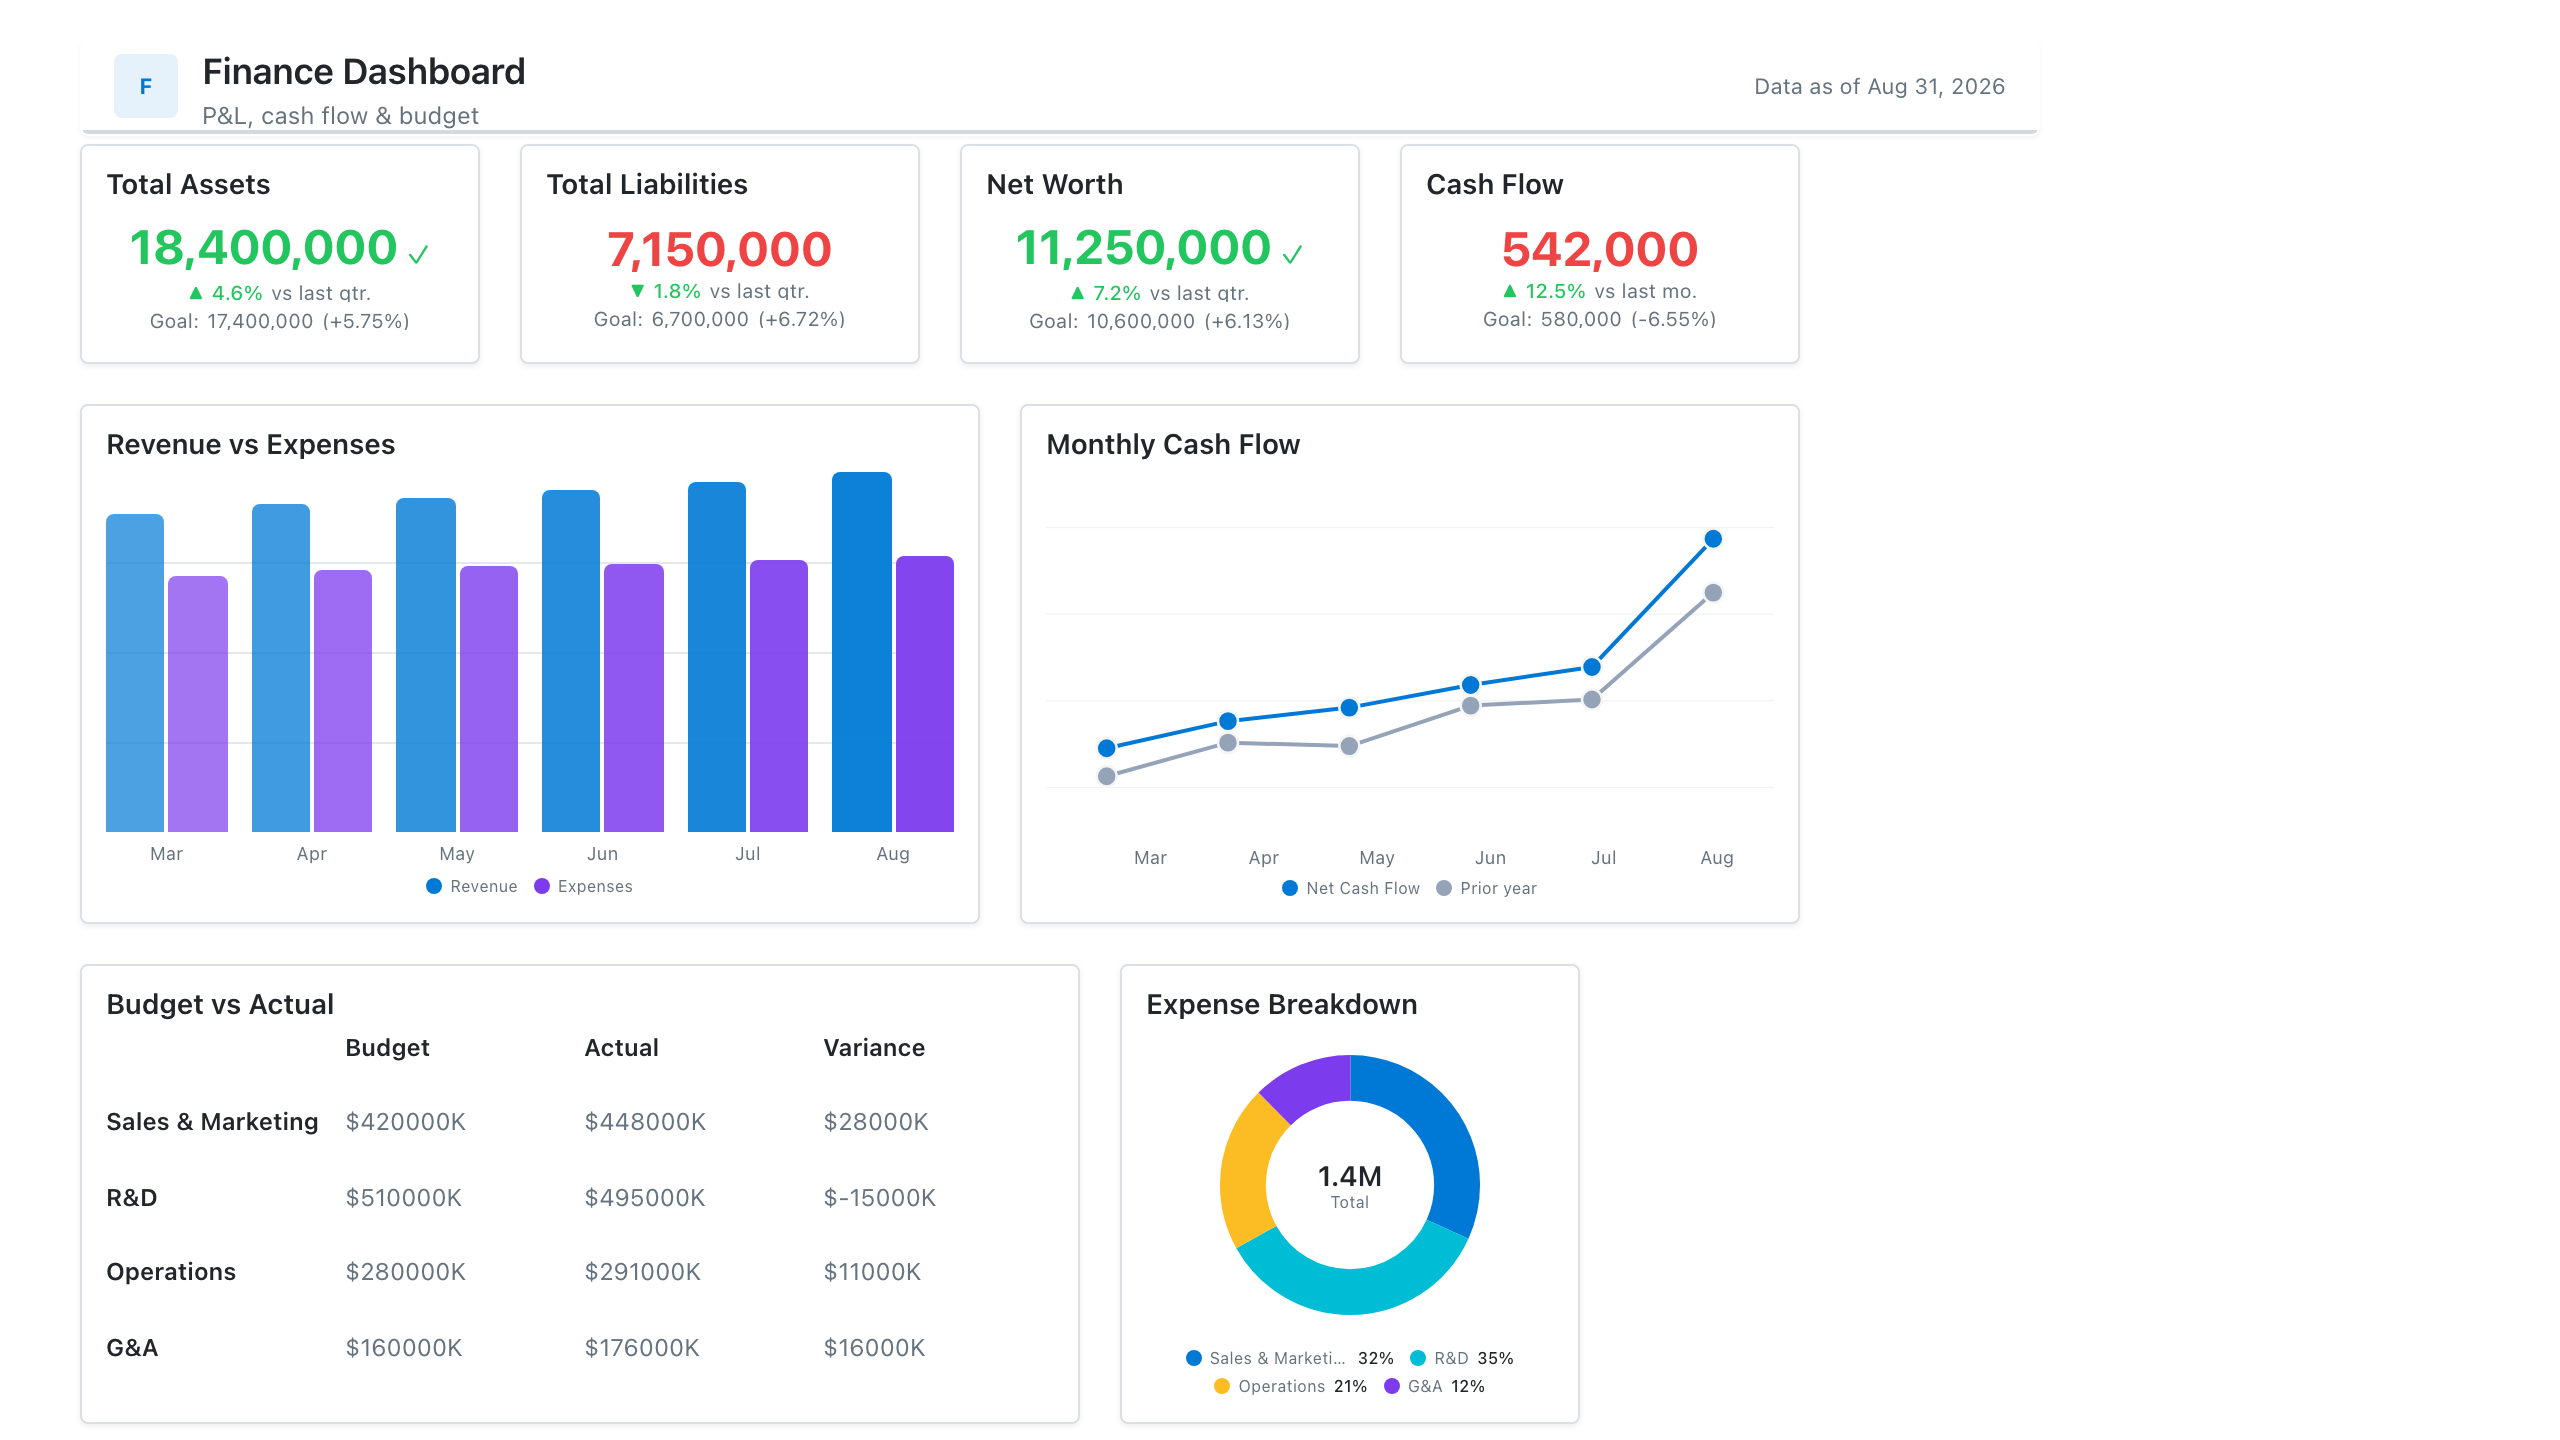
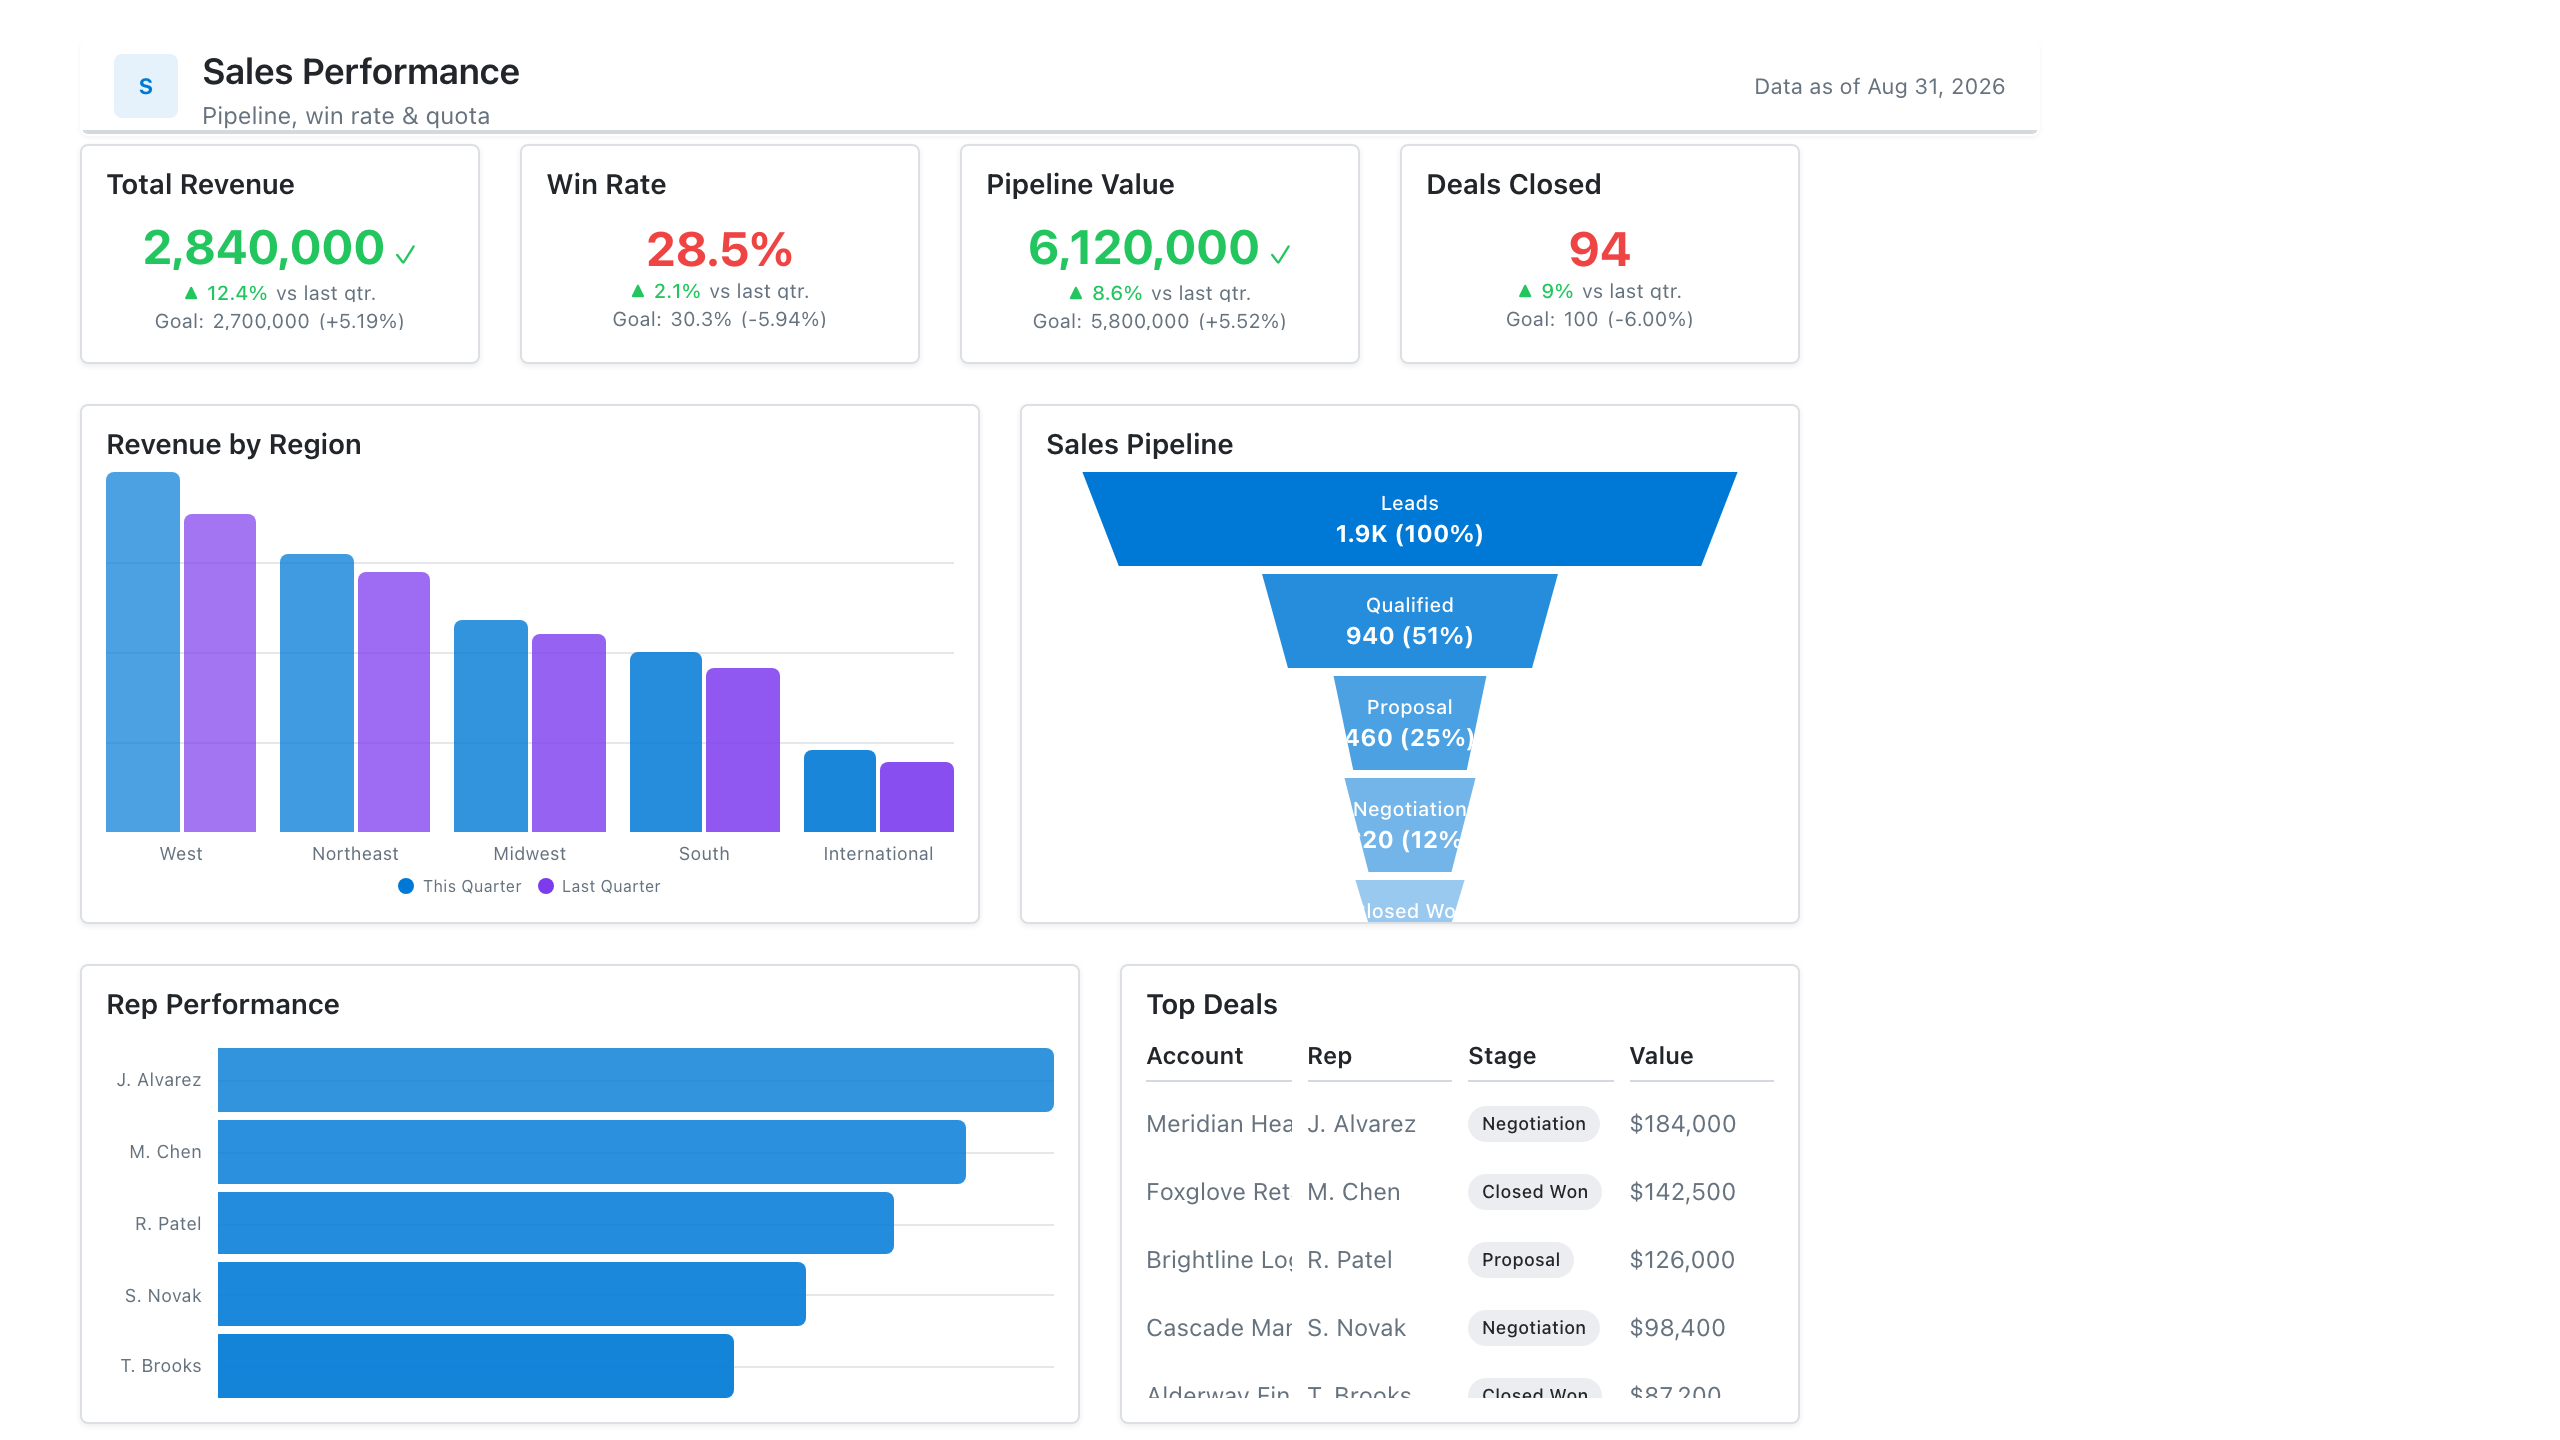
A mockup shows which fields are filters (columns) and which are numbers (measures) before anyone writes DAX: slicers and row headings are columns, KPI cards and values are measures. See why to mock up Power BI reports before you build.