What’s inside one
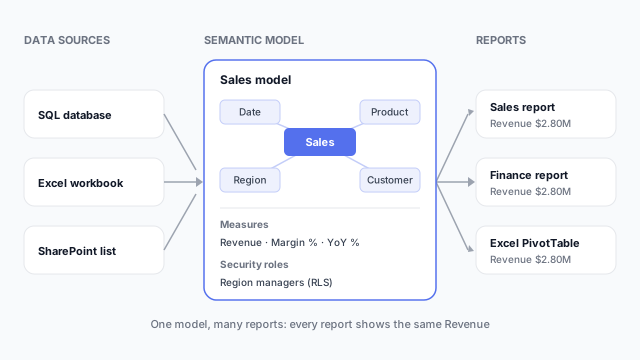
When you build a report in Power BI Desktop and publish it, two items appear in the Power BI service: the report, and the semantic model behind it. The model is everything the visuals need to get their numbers:
- Tables and their data, loaded from sources such as SQL databases, Excel files and SharePoint lists, usually shaped on the way in with Power Query.
- Relationships between tables, typically a fact table (Sales) related to dimension tables (Date, Product, Region, Customer).
- Measures and calculated columns, written in DAX, such as Revenue, Margin % and YoY %.
- Security roles, such as row-level security that shows each regional manager only their region.
- A storage mode for each table, Import or DirectQuery, and for imported data a refresh schedule.
It’s called “semantic” because it adds meaning on top of raw tables: friendly names, formats, hierarchies and agreed definitions, so “Revenue” means one thing.
One model, many reports
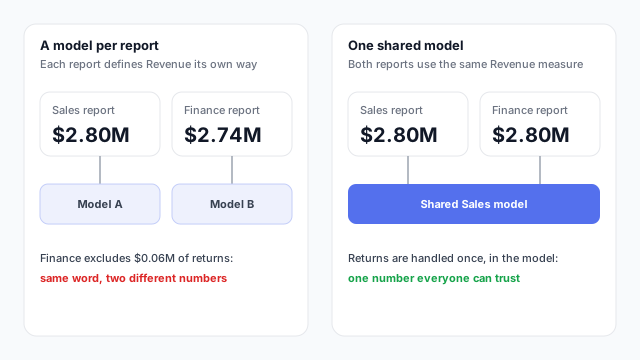
The most common mistake with semantic models is having too many of them. If every report imports its own copy of the sales data and defines Revenue its own way, two reports will disagree sooner or later. In the example, Finance excludes $0.06M of returns, so its Revenue is $2.74M while the Sales report shows $2.80M.
A shared model fixes that. Build and publish the model once, then connect each new report to it. The reports carry only pages and visuals, and every one of them shows the same $2.80M. People often call this pattern “thin reports” on a “golden” or “certified” model. The same model can also be explored in Excel with Analyze in Excel.
Semantic model vs. Tableau
Tableau splits the same job differently. The closest equivalent is a published data source: connections, joins or relationships, calculated fields and filters, shared on Tableau Server or Tableau Cloud so many workbooks can use it.
Best practices
- Start from a star schema. One fact table surrounded by dimension tables keeps relationships simple and DAX predictable.
- Put shared logic in measures. A calculation defined once in the model beats the same formula rebuilt in five reports.
- Hide what readers don’t need. Hide key columns and helper tables so report builders see a clean field list.
- Name things the business way. “Revenue” and “Region”, not “SUM_AMT” and “dim_geo_cd”.
- Separate model and reports early. Splitting a report into a shared model plus thin reports is easier before ten copies exist.
Mocking up the reports on a semantic model
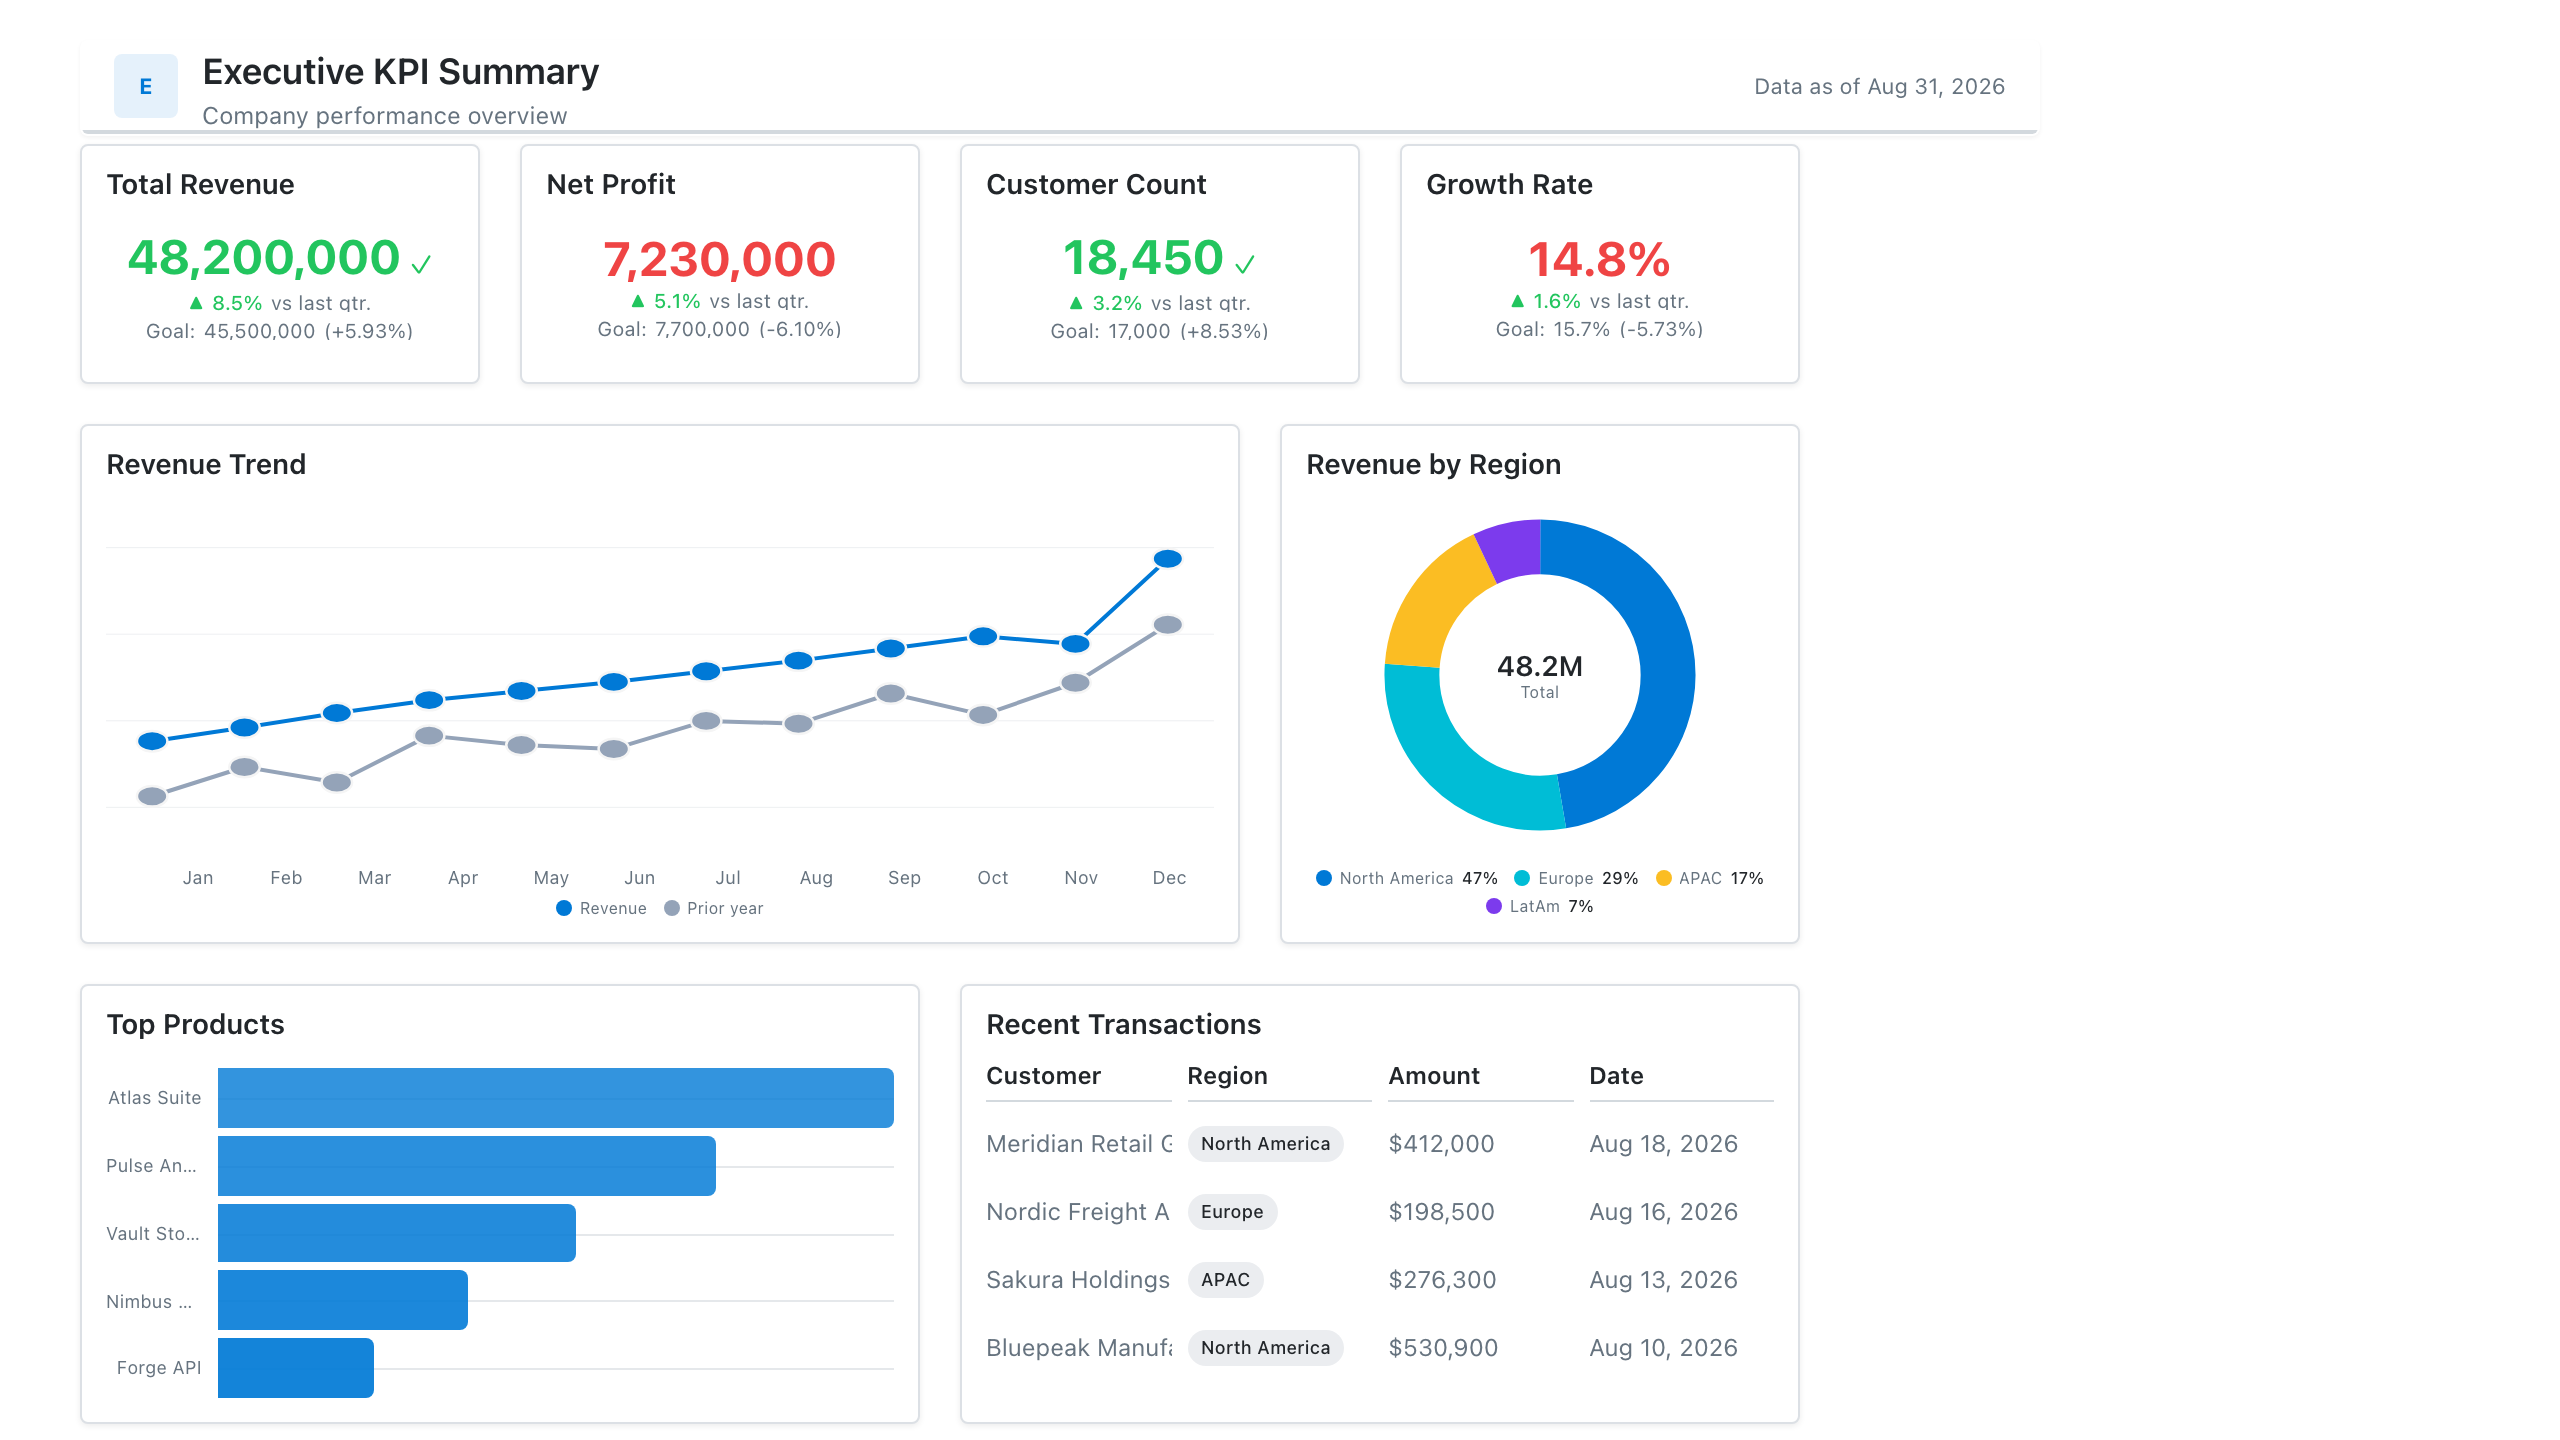
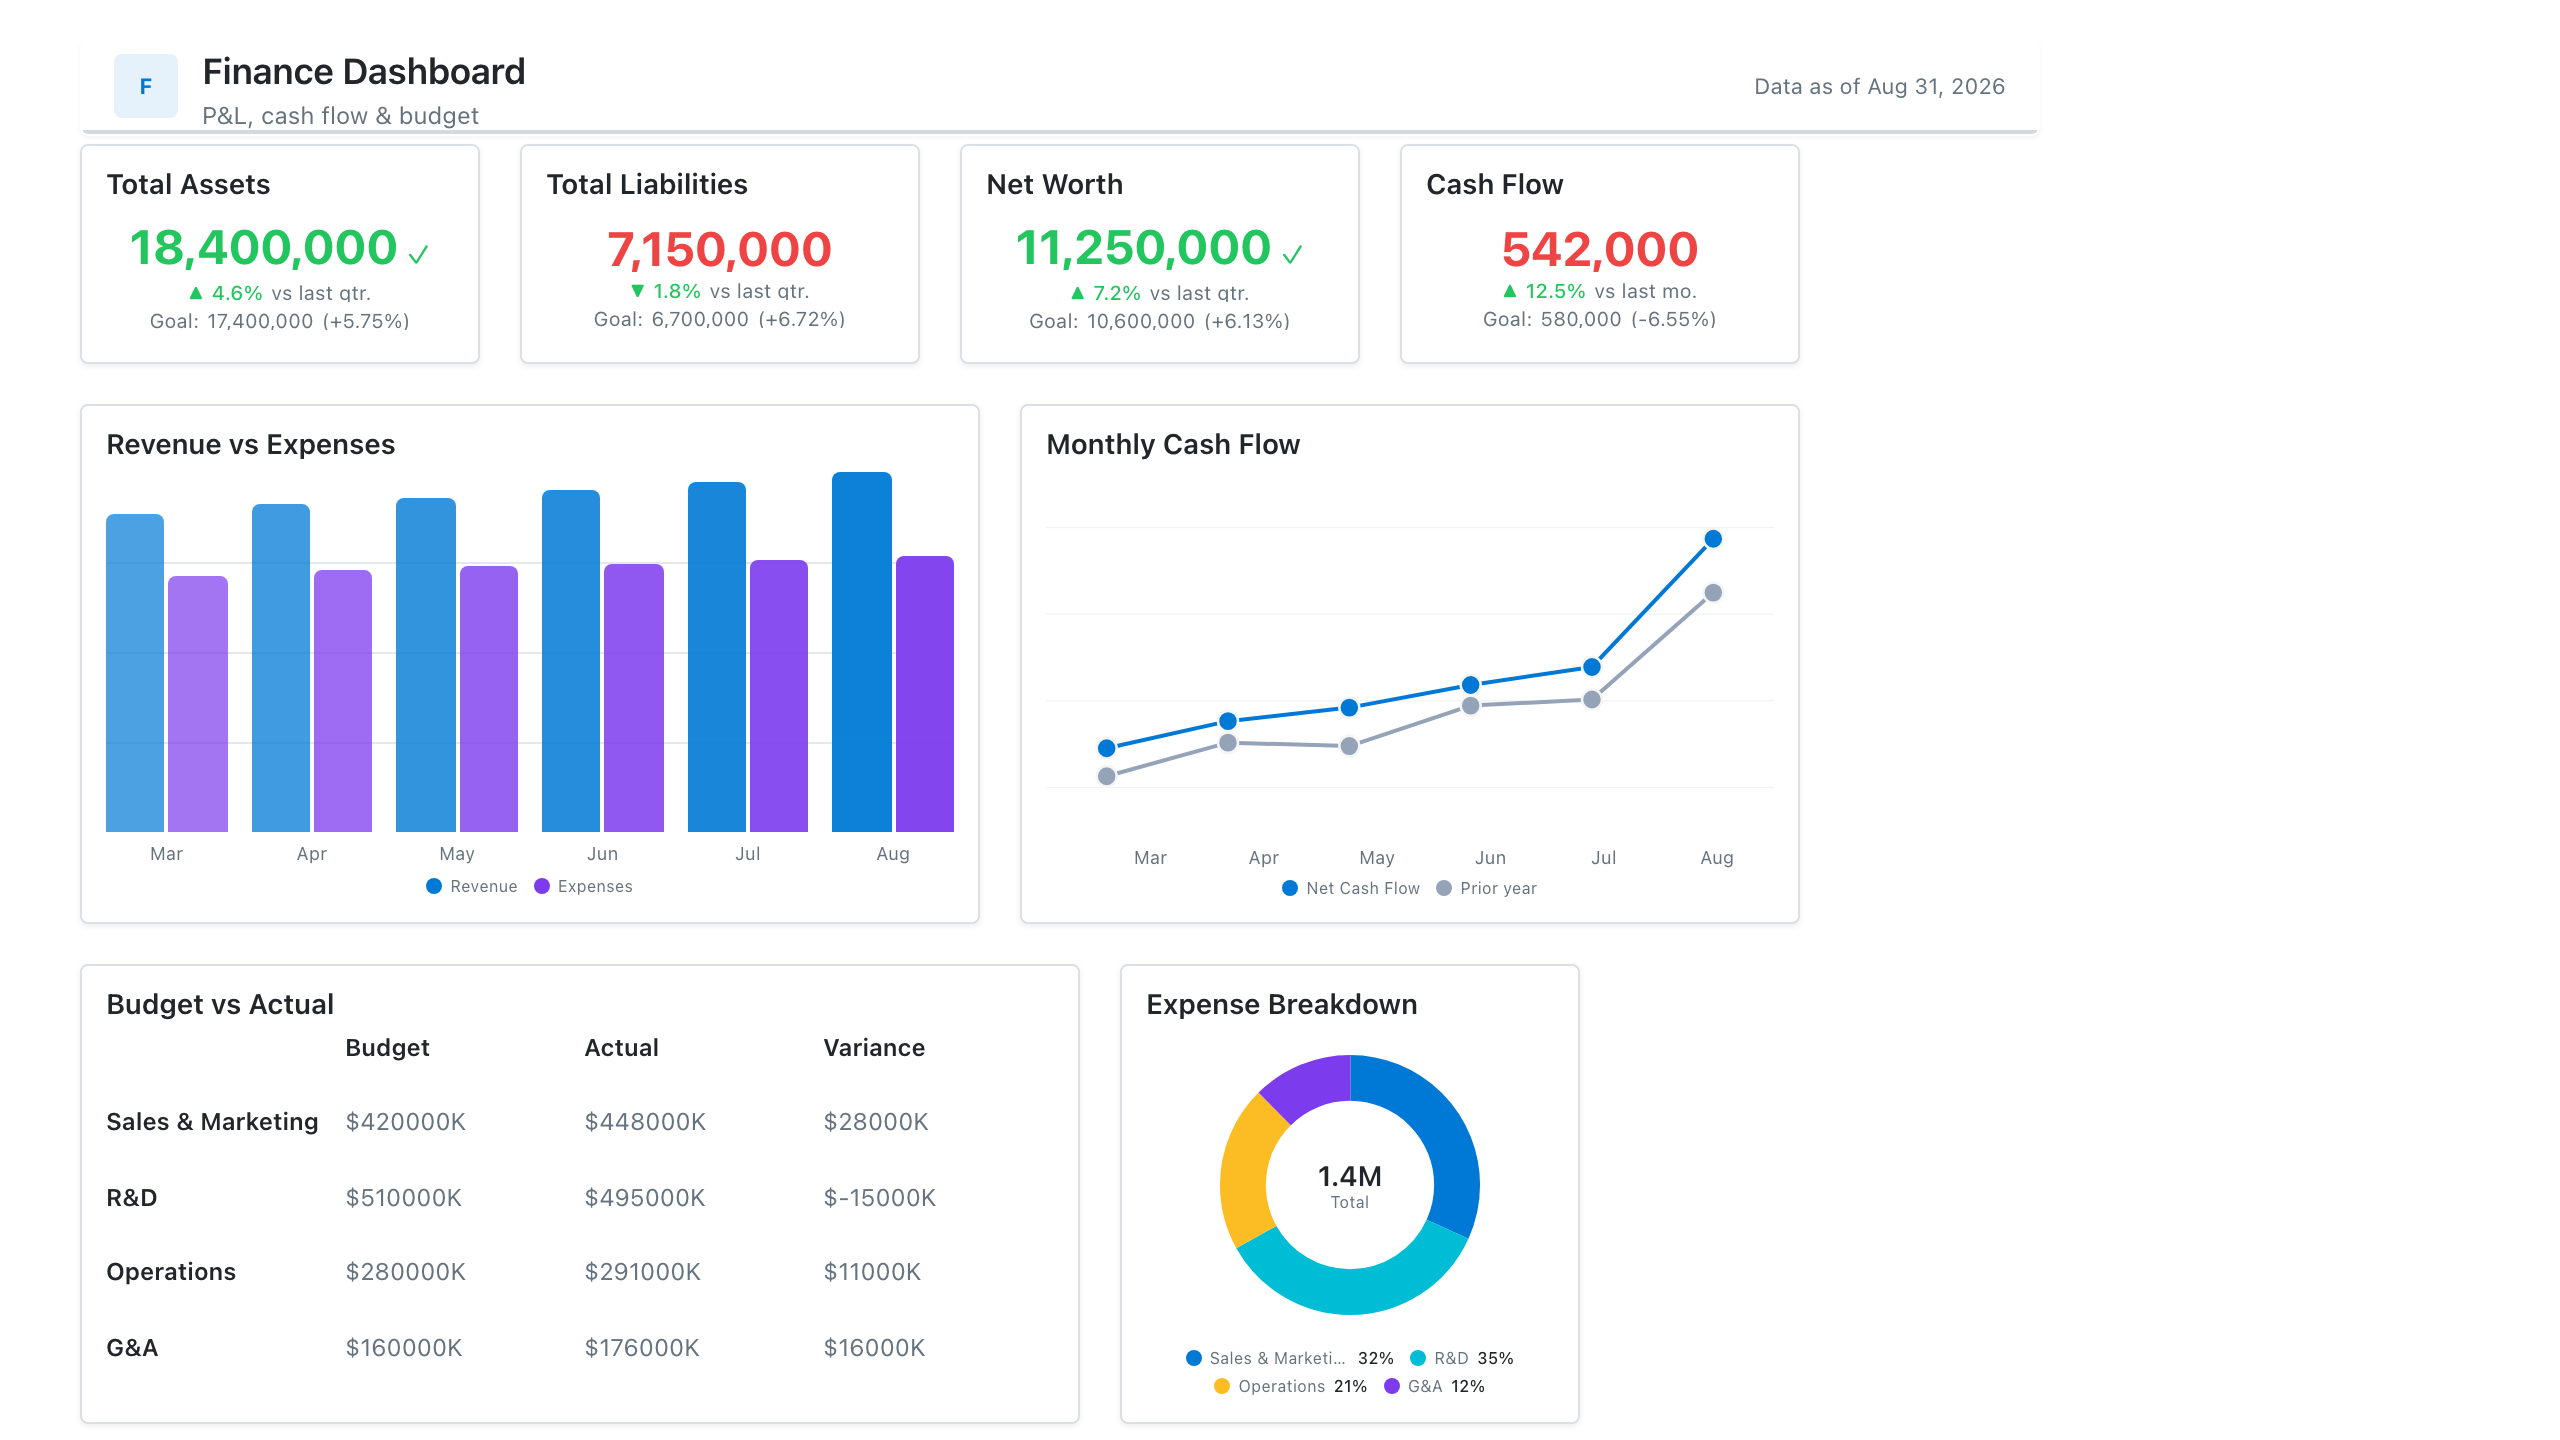
Every KPI card and chart on a mockup is a request for a measure in the model. Agreeing the page design first gives the model builder a concrete list of measures and fields to build. See why to mock up Power BI reports before you build.