Visuals

Scatter Plot

Also called: Scatter chart, Scatter graph, Scattergram, XY chart

A scatter plot places one dot per item on two numeric axes, such as ad spend against revenue, so you can see whether the two measures move together and spot outliers.
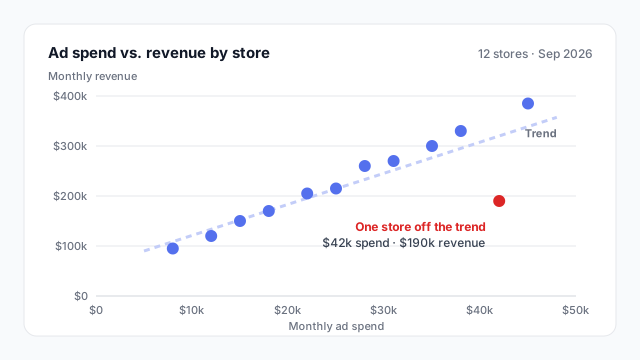
Scatter plot of 12 stores by monthly ad spend ($8k to $45k) and monthly revenue ($95k to $385k). Revenue rises with spend along a dashed trend line, except one red outlier store with $42k spend and $190k revenue.

How to read a scatter plot

Each dot is one item: a store, a customer, a product, a sales rep. Its position comes from two measures, one on each axis. In the chart above, every store is placed by its monthly ad spend (x) and its monthly revenue (y).

Read it in three passes:
  1. Direction. Do the dots climb from bottom-left to top-right? Then the measures rise together.
  2. Strength. Are the dots tight around a line, or a loose cloud? A dashed trend line makes this easier to judge.
  3. Exceptions. Which dots sit far from the rest? Here, one store spends $42k a month but brings in only $190k. That’s the store worth a phone call, and you’d never see it in a total.

Patterns to look for

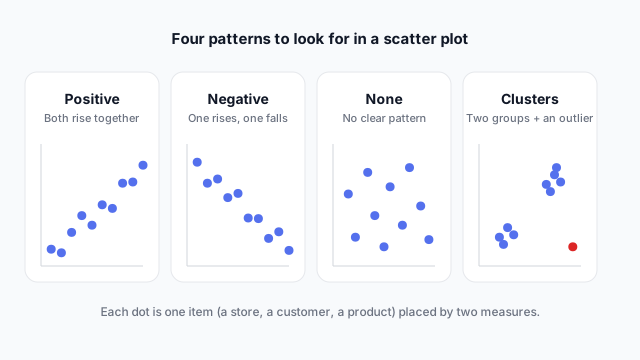
Four small scatter plots: positive relationship, negative relationship, no relationship, and two clusters plus a red outlier

  • Positive: both measures rise together, like spend and revenue.
  • Negative: one rises as the other falls, like price and units sold.
  • None: no pattern. That’s a useful answer too: the measure you hoped would drive results probably doesn’t.
  • Clusters and outliers: separate groups (e.g. small and large stores) or single dots far from everything else.

Common uses

Ordered from most to least common on business dashboards.

1. Quadrant analysis

Draw reference lines at the average of each measure and the chart splits into four groups. Product teams use it for volume vs. margin, sales teams for deal count vs. win rate.
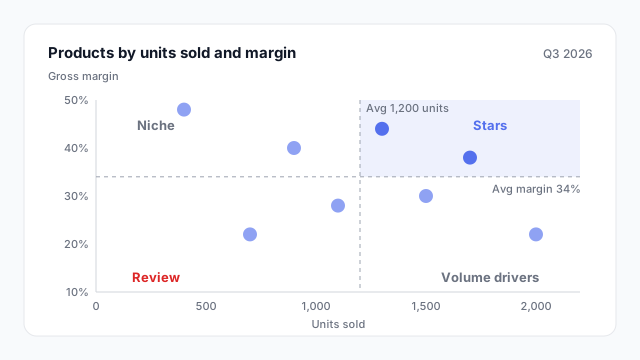
Quadrant scatter plot of eight products by units sold and margin, split at the averages of 1,200 units and 34% into Stars, Volume drivers, Niche and Review

2. Spend vs. return

Marketing spend against revenue or leads, by campaign or by store. The trend line shows the typical return and the outliers show where money isn’t working.

3. Performance vs. effort

Tickets handled against customer satisfaction by agent, or hours logged against output by team. It shows who is fast and good, not just fast.

In Power BI vs. Tableau

Power BITableau
Built-in visualScatter chartA measure on Columns and another on Rows
One dot per itemPut the item field (e.g. Store) in ValuesPut the item dimension on Detail
Trend lineAnalytics paneAnalytics pane

Best practices

  • Label the outliers, not every dot. A dozen labels turn into noise; one or two tell the story.
  • Say what one dot is in the title or subtitle (“12 stores”, “one dot per customer”).
  • Keep both axes honest. Starting an axis above zero is fine on a scatter plot, but say so with clear tick labels.
  • Don’t imply cause. Write “stores that spend more tend to earn more”, not “spend drives revenue”.

Mocking up a scatter plot

Scatter plots raise a question stakeholders rarely think about up front: what is one dot? Settle that on a mockup, along with which outliers to label, before anyone builds the measures.

See it in a real layout

These free Mockko templates use it. Open one and edit it in your browser.

Related terms

Common questions

What is a scatter plot used for?
To check whether two measures are related, such as spend and revenue or price and units sold, and to find the items that don't follow the pattern. Each dot is one item, so it also shows clusters and outliers that an average would hide.
Does a scatter plot show cause and effect?
No. It shows that two measures move together (correlation), not that one causes the other. Both might be driven by a third factor, such as store size driving both ad budget and revenue.
What's the difference between a scatter plot and a line chart?
A line chart has a category or time on the x-axis and connects the points in order. A scatter plot has a measure on both axes, and the dots aren't connected because each one is a separate item.

Mock it up before you build it

Lay out your Power BI or Tableau dashboard in Mockko, get sign-off, then build. Free to start.

Try Mockko free