Sales Rep Leaderboard Dashboard Mockup Template
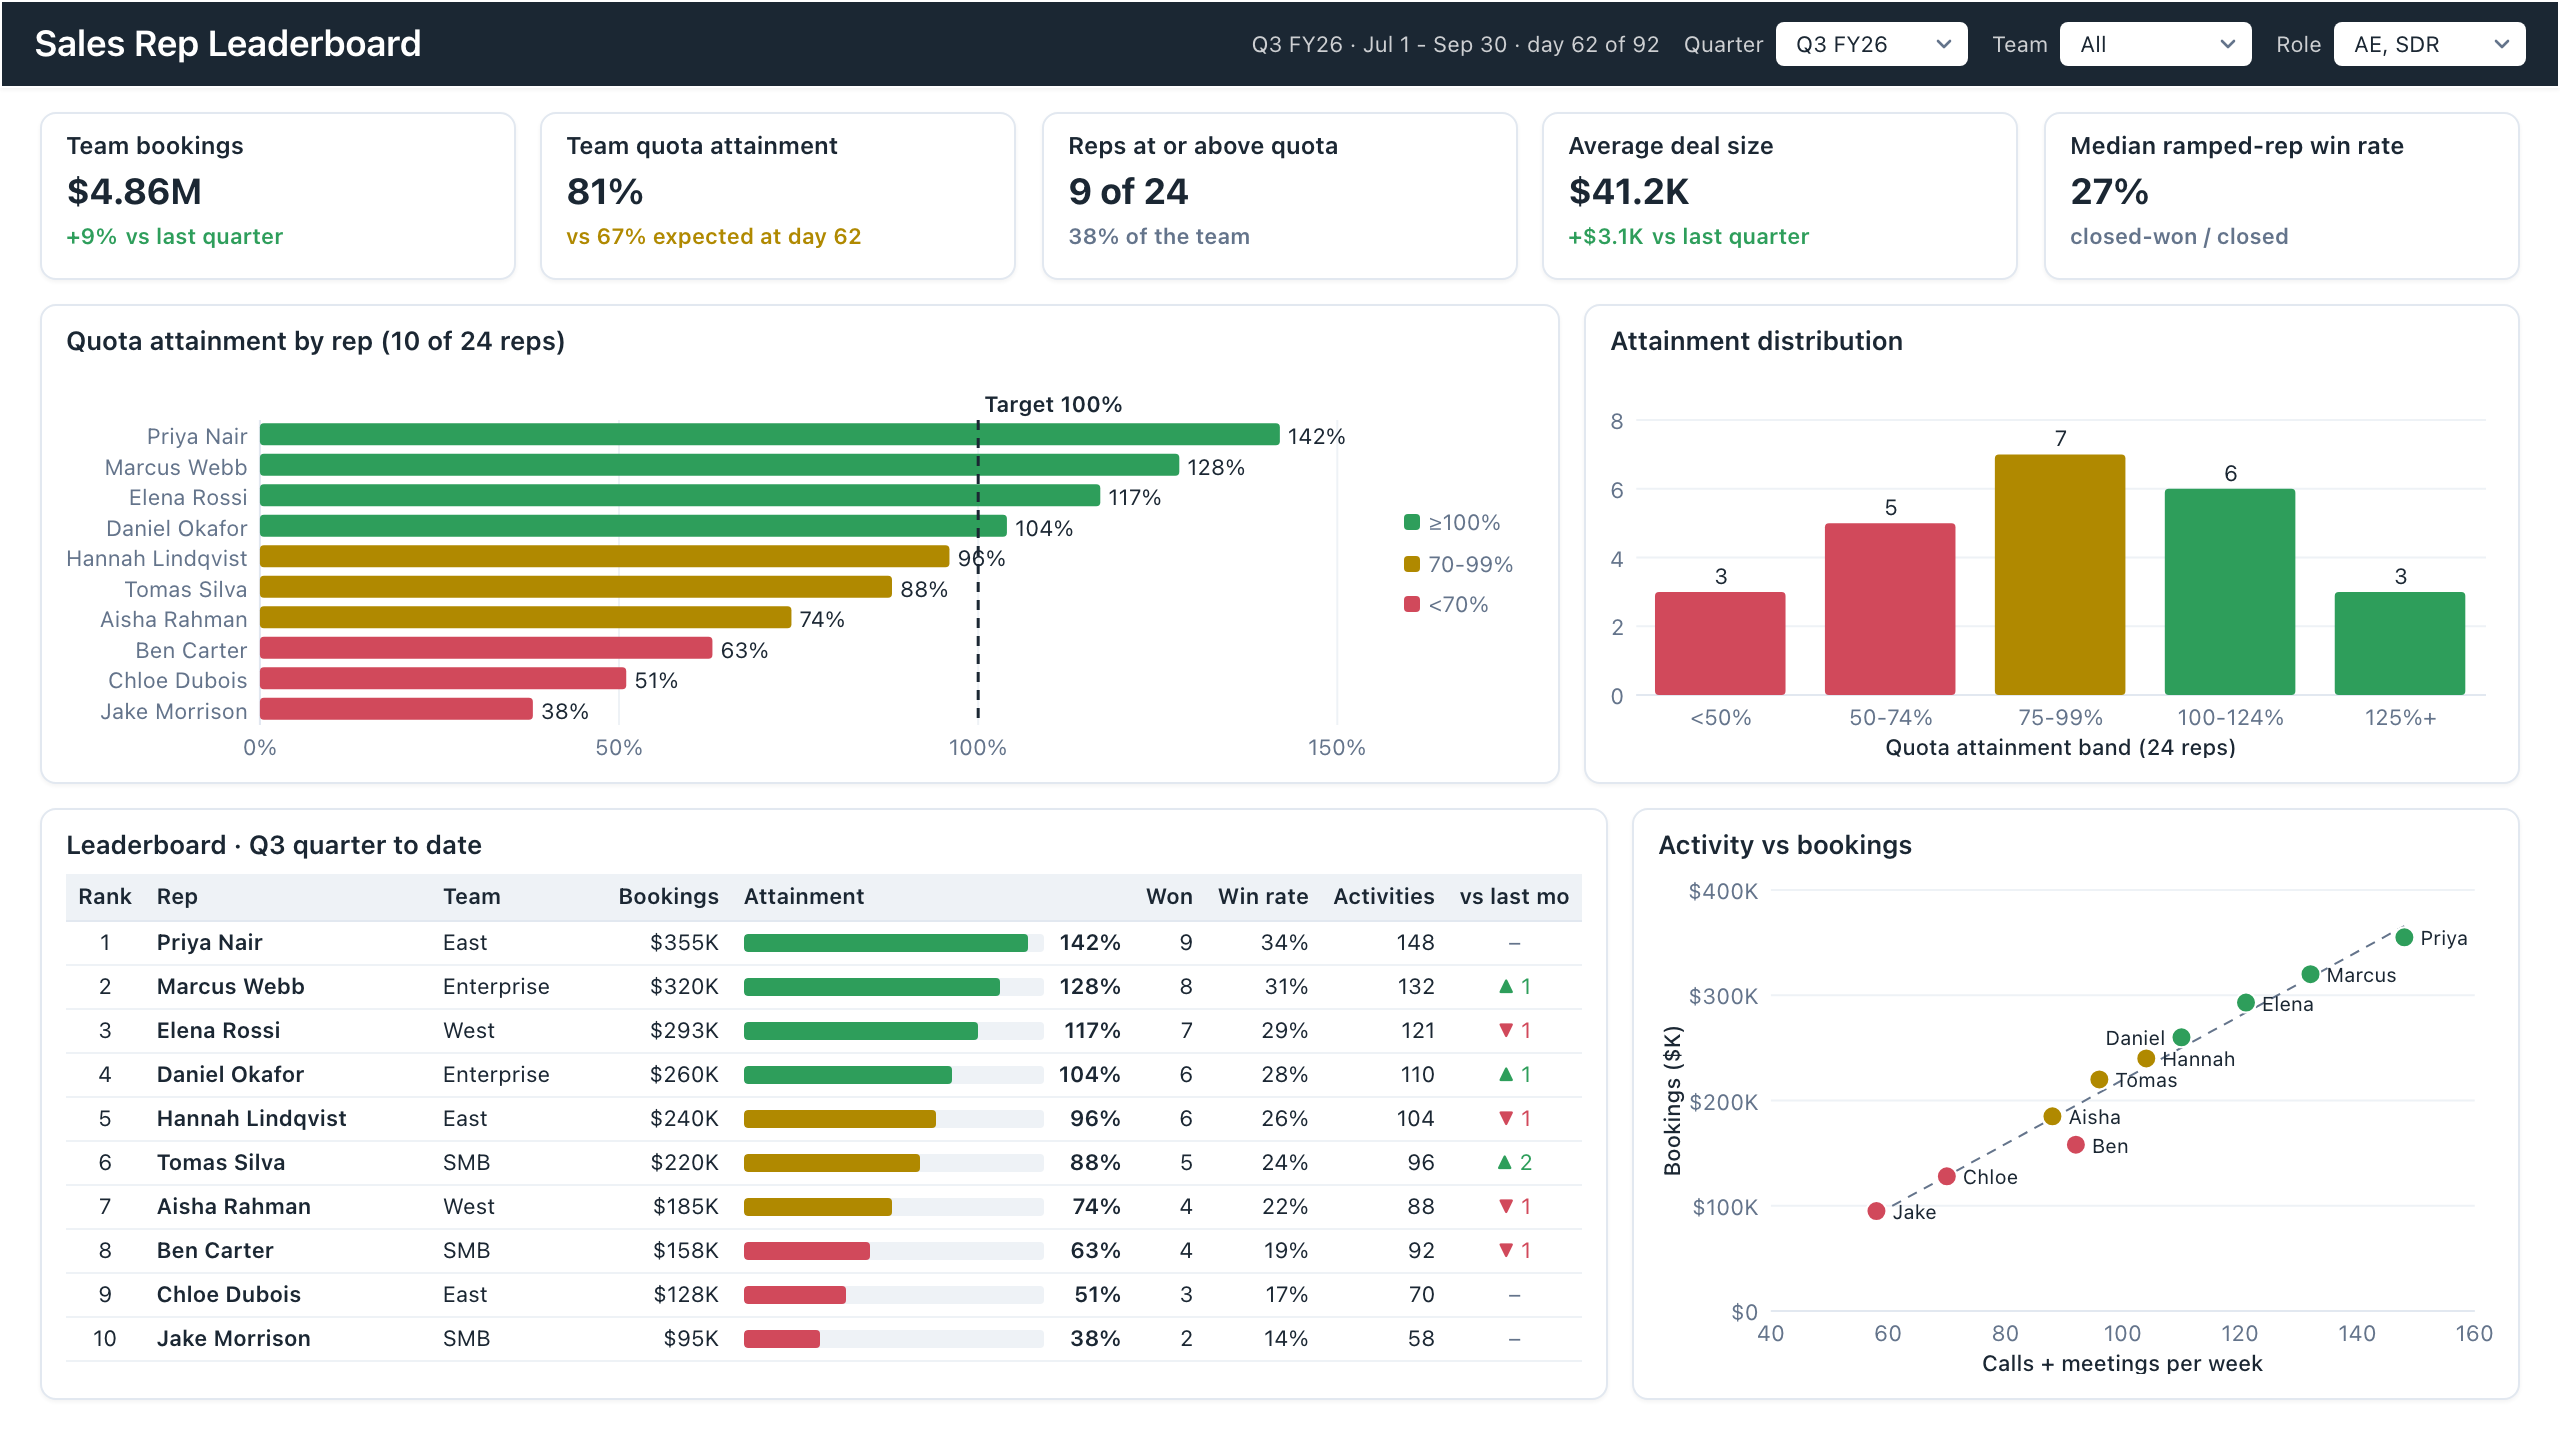
The Sales Rep Leaderboard template is a one-page layout for VPs of Sales and front-line sales managers, built for the weekly sales meeting and monthly commission review to decide who is ahead of quota and who needs coaching. It shows team bookings, quota attainment, reps at or above quota, average deal size and median win rate.
Click the mockup to open it full size
About this template
SalesThis sales rep dashboard example ranks every rep on quota attainment for the weekly sales meeting and the monthly commission review, so a VP of Sales or front-line manager can see who is ahead, who is behind and why. Five KPIs (team bookings, quota attainment, reps at or above quota, average deal size, median win rate) sit above a ranked bar chart with a 100% target line, an attainment distribution histogram, a 10-rep leaderboard table with rank change versus last month, and a scatter of weekly activity against bookings. Bars and dots are coloured by tier (100% and up, 70-99%, under 70%), so the red reps stand out before anyone reads a number.
Metrics this dashboard tracks
- Team bookings
- Team quota attainment vs. expected pace
- Reps at or above quota
- Quota attainment by rep
- Attainment distribution
- Leaderboard with rank change
- Activity vs. bookings
What's on the Sales Rep Leaderboard dashboard?
| Section | What it shows | Why it's here |
|---|---|---|
| Header and filters Title bar with three filter chips | The title "Sales Rep Leaderboard", the period "Q3 FY26 · Jul 1 - Sep 30 · day 62 of 92", and dropdowns for quarter (Q3 FY26), team (All) and role (AE, SDR). | Shows how far into the quarter the numbers are, so every attainment figure is read against the right point in time, and lets one page serve any team or role. |
| KPI row Five KPI cards | Team bookings $4.86M (+9% vs last quarter), team quota attainment 81% (vs 67% expected at day 62), reps at or above quota 9 of 24 (38% of the team), average deal size $41.2K (+$3.1K vs last quarter) and median ramped-rep win rate 27% (closed-won / closed). | Answers whether the team is ahead of pace before any rep is named. The 81% against 67% expected tells the reader the team is ahead, while 9 of 24 shows that few reps carry it. |
| Attainment row Ranked bar chart with target line, column chart | Quota attainment for 10 of 24 reps, from Priya Nair at 142% down to Jake Morrison at 38%, with a dashed 100% target line and bars coloured green, amber or red. Beside it, a histogram of all 24 reps by band: under 50% 3, 50-74% 5, 75-99% 7, 100-124% 6 and 125% and up 3. | The bars show who is where, and the histogram shows the shape of the whole team, so the reader can tell whether a few reps are far behind or many are just short of quota. |
| Leaderboard and activity row Table with data bars, scatter chart | A ranked table of the same 10 reps with team, bookings, attainment bar and percent, deals won, win rate, activities and rank change versus last month (for example Priya Nair, East, $355K, 142%, 9 won, 34%, 148 activities). Beside it, a scatter of calls and meetings per week against bookings, one labelled dot per rep with a trend line. | The table is the agenda for the meeting and the rank arrows show who is climbing or sliding. The scatter shows whether low bookings come with low activity or with the same effort and weaker results, which changes the coaching conversation. |
What each metric means
Team bookings
- Definition: The total value of deals closed-won by the team in the quarter to date. Some companies count bookings at contract signature and others at first invoice, so state which one you use.
- Formula:
Team bookings = sum of amount for closed-won deals in the period - Why it matters: It is the revenue result that quota attainment is measured against.
- Why a KPI card: One large number with a change versus last quarter gives the headline result at a glance.
Team quota attainment
- Definition: Bookings as a share of the quota assigned for the period. Next to it, the share of the period already elapsed is the expected pace: a team that is 62 of 92 days into the quarter would be expected to be about two thirds of the way to quota if quota is spread evenly.
- Formula:
Quota attainment = bookings / quota; expected pace = days elapsed / days in period - Why it matters: Comparing attainment with expected pace shows whether the team is ahead or behind, which attainment alone cannot.
- Why a KPI card: The percentage and the expected-pace caption sit together, so the gap is read in one look.
Reps at or above quota
- Definition: The number of reps whose attainment is 100% or more, shown against the total number of reps and as a share of the team.
- Formula:
Reps at or above quota = count of reps with attainment >= 100% - Why it matters: It shows how widely the result is shared. A team can be ahead on total bookings while only a minority of reps are at quota.
- Why a KPI card: A count out of a total with a percentage caption is a single figure that suits a card.
Average deal size
- Definition: The average amount of a closed-won deal in the period.
- Formula:
Average deal size = bookings / number of closed-won deals - Why it matters: Together with win rate it shows whether bookings come from bigger deals or from more deals.
- Why a KPI card: One figure with a change versus last quarter is enough to see whether deals are getting larger.
Median ramped-rep win rate
- Definition: The middle win rate across reps who have finished onboarding, based on closed deals. Whether it counts deals or value, and how ramped is defined, is set by each company.
- Formula:
Win rate = closed-won deals / (closed-won + closed-lost deals); take the median across ramped reps - Why it matters: The median is less affected by one unusually strong or weak rep than the average, and leaving out new hires avoids blaming ramp time on skill.
- Why a KPI card: A single percentage with a short caption suits a rate that moves slowly.
Quota attainment by rep
- Definition: Each rep's bookings divided by that rep's own quota, ranked from highest to lowest and coloured by tier against a 100% target line.
- Formula:
Rep attainment = rep bookings / rep quota - Why it matters: Quotas differ by rep, so attainment compares people fairly where raw bookings would not.
- Why a ranked bar chart: Horizontal bars sorted by value make the ranking and the distance from the 100% line easy to read, and long rep names fit on the axis.
Attainment distribution
- Definition: The number of reps in each attainment band: under 50%, 50-74%, 75-99%, 100-124% and 125% and up.
- Formula:
Reps in band = count of reps whose attainment falls in the band - Why it matters: It shows the spread across the whole team, including reps not listed on the ranked chart.
- Why a column chart: Columns for ordered bands show the shape of the distribution, which a ranked list of names does not.
Leaderboard rank and rank change
- Definition: Each rep's position by attainment this quarter, with an arrow showing how many places they moved compared with last month, alongside deals won, win rate and activities.
- Formula:
Rank change = last month's rank - current rank - Why it matters: A rep who is climbing and a rep who is sliding need different conversations, even if both sit mid-table.
- Why a table with data bars: A table keeps exact values, and the bar in the attainment column adds a quick visual ranking without a second chart.
Activity vs bookings
- Definition: Calls and meetings per week for each rep plotted against that rep's bookings, with a trend line. What counts as an activity is set by each company.
- Formula:
Activity level = (calls + meetings) / weeks in period - Why it matters: It shows whether activity goes with revenue. Reps far below the trend line work as much as peers but close less, and reps far below on both axes may need a different conversation.
- Why a scatter chart: Two measures per rep on two axes show the relationship and the outliers, which a table cannot.
Data you need to build this
- CRM (Salesforce, HubSpot or similar), opportunity object Deal ID, Owner (rep), Amount, Status (won, lost, open), Close date, Team and role
- Quota or compensation planning sheet Rep, Fiscal period, Quota, Start date (to flag ramping reps), Team
- CRM activity log or sales engagement tool (Outreach, Salesloft or similar) Rep, Activity type (call, meeting, demo), Activity date
- HRIS or sales operations roster Rep, Role (AE, SDR), Team, Hire date, Ramp status
Why it's laid out this way
- The five KPI cards come first so the reader knows whether the team is ahead of pace before any rep is named. Attainment is paired with the expected pace for the point in the quarter, so 81% is read against 67% and not in isolation.
- The top row pairs the ranked bars with the distribution histogram: one shows individuals against the 100% target line, the other shows the shape of the whole team. Both use the same colour tiers, so red means the same thing in every visual.
- The bottom row puts the leaderboard table beside the scatter plot. The table is the list to discuss, and the scatter explains it, by showing whether a rep's result follows their activity level.
Last updated:
More like this
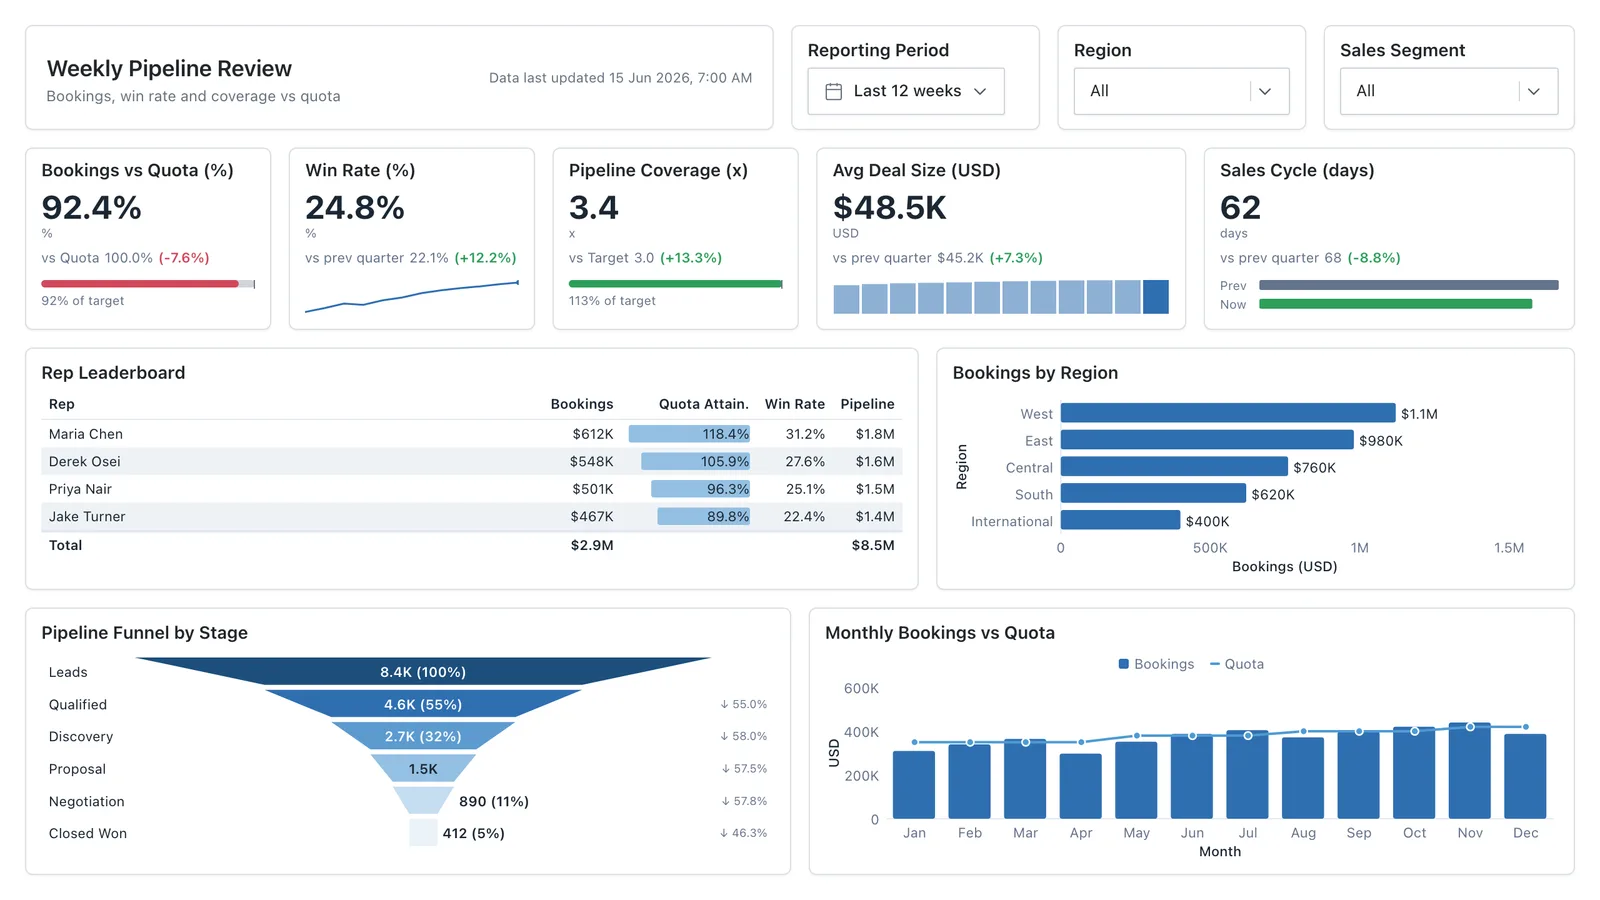
Sales Performance
Revenue, win rate, pipeline value, and rep performance across regions — the layout most sales teams build first.
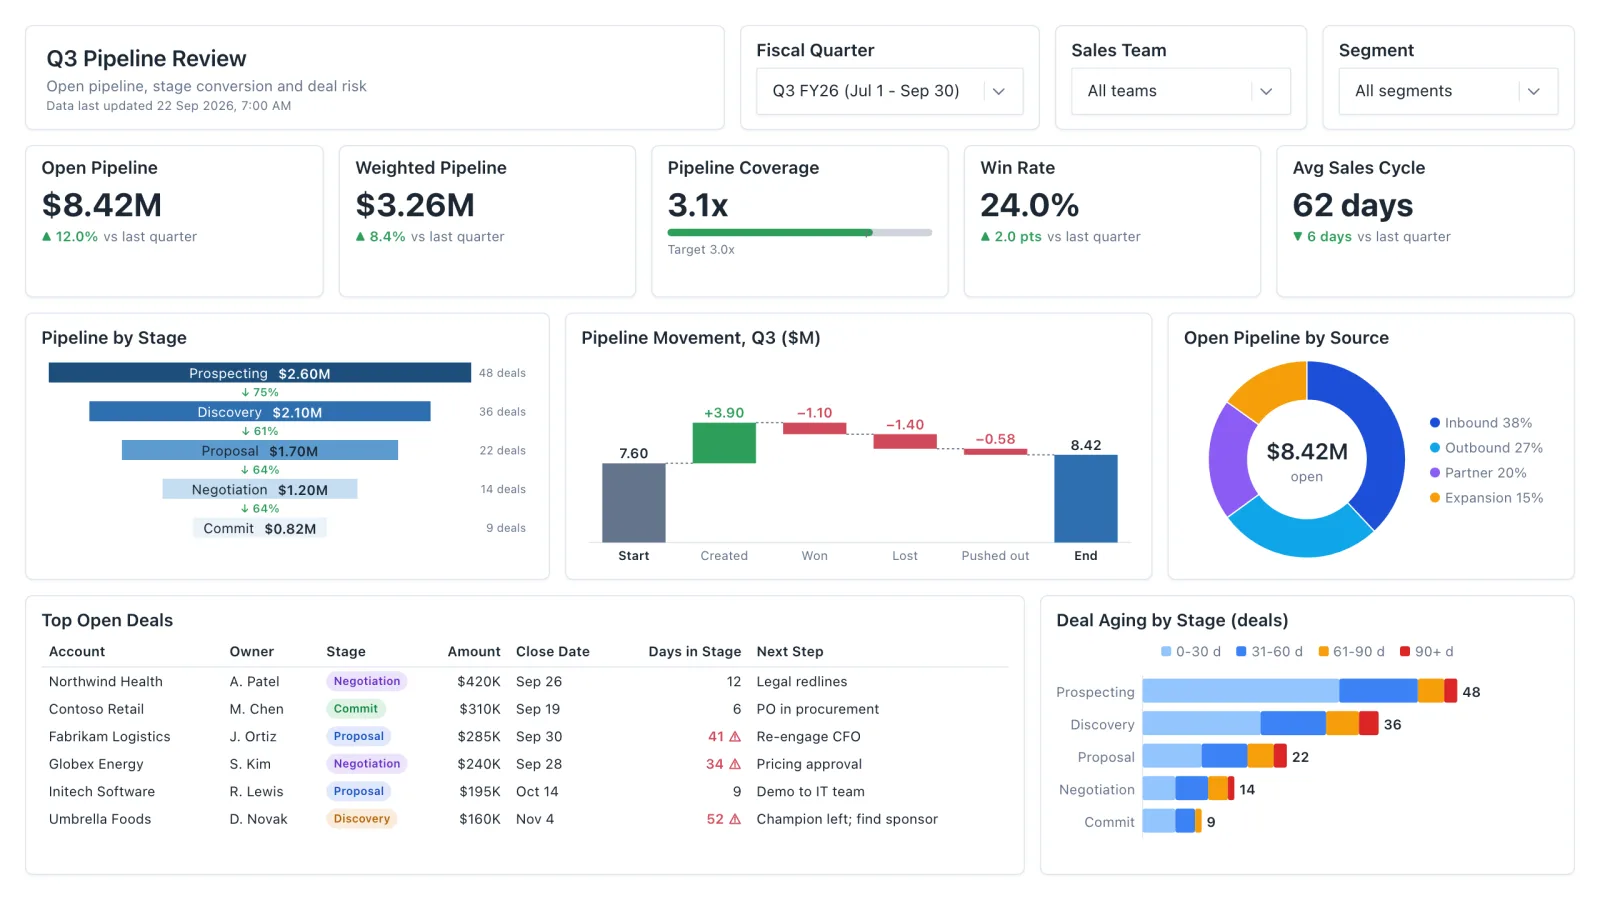
Sales Pipeline
Sales pipeline dashboard with open and weighted pipeline, coverage vs target, a stage funnel and stale-deal flags.
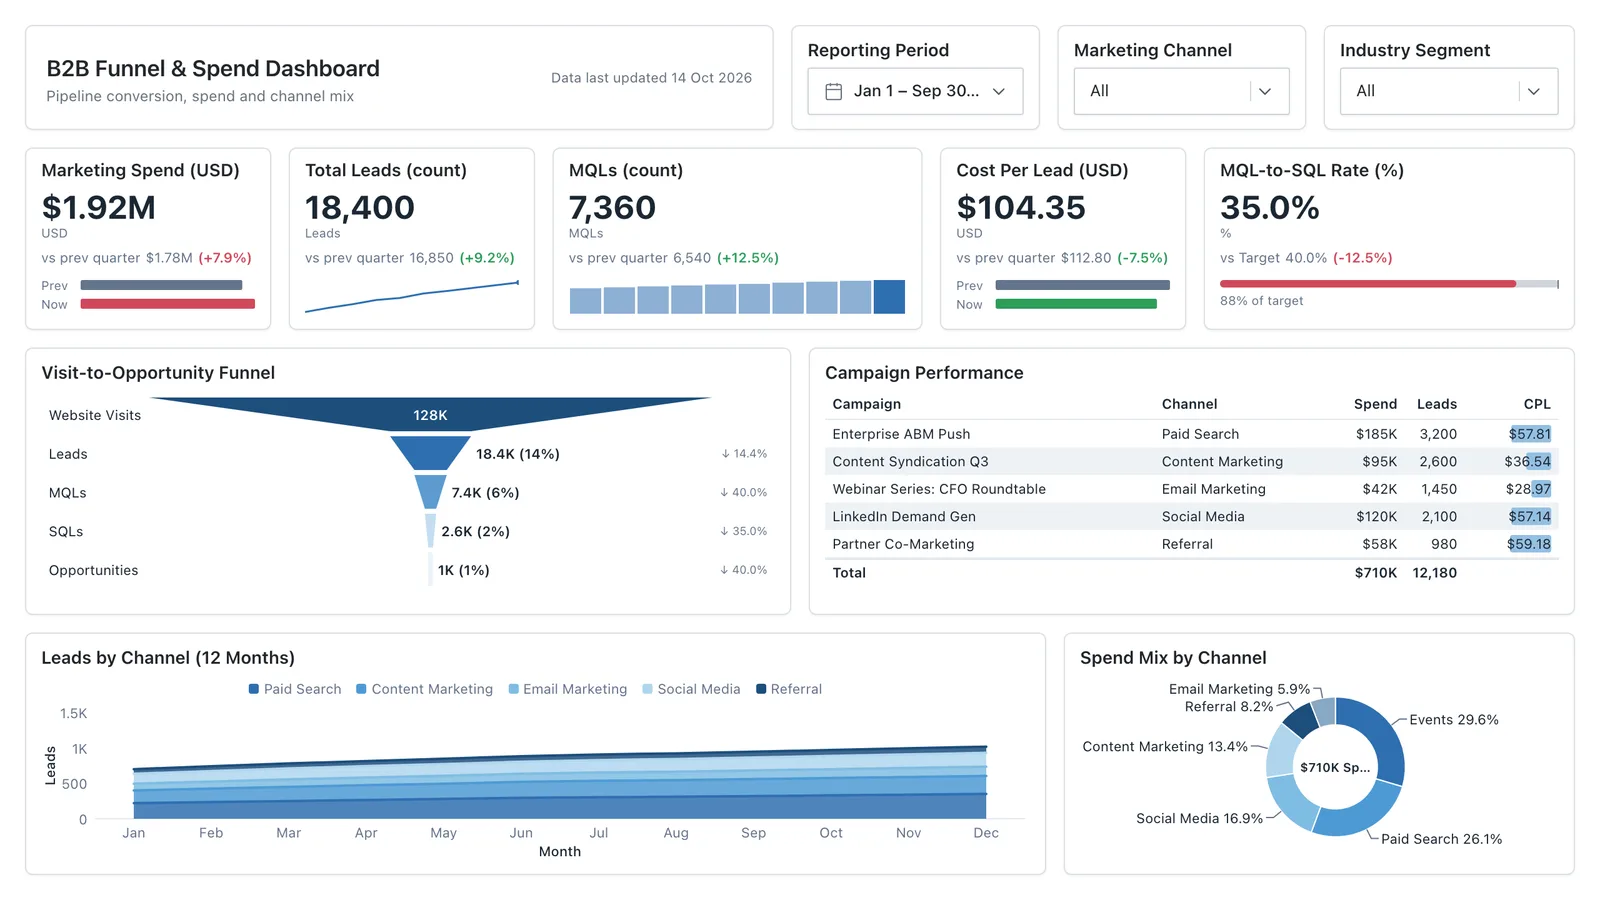
Marketing Analytics
Campaign spend, traffic sources, conversion funnel, and lead volume in one wireframe.
Executive KPI Overview
Single-page executive view of the metrics leadership cares about — built for the first client meeting.
Sales, finance, HR, SaaS, and more — filter by team or search by metric.