Budget vs Actual Variance Dashboard Mockup Template
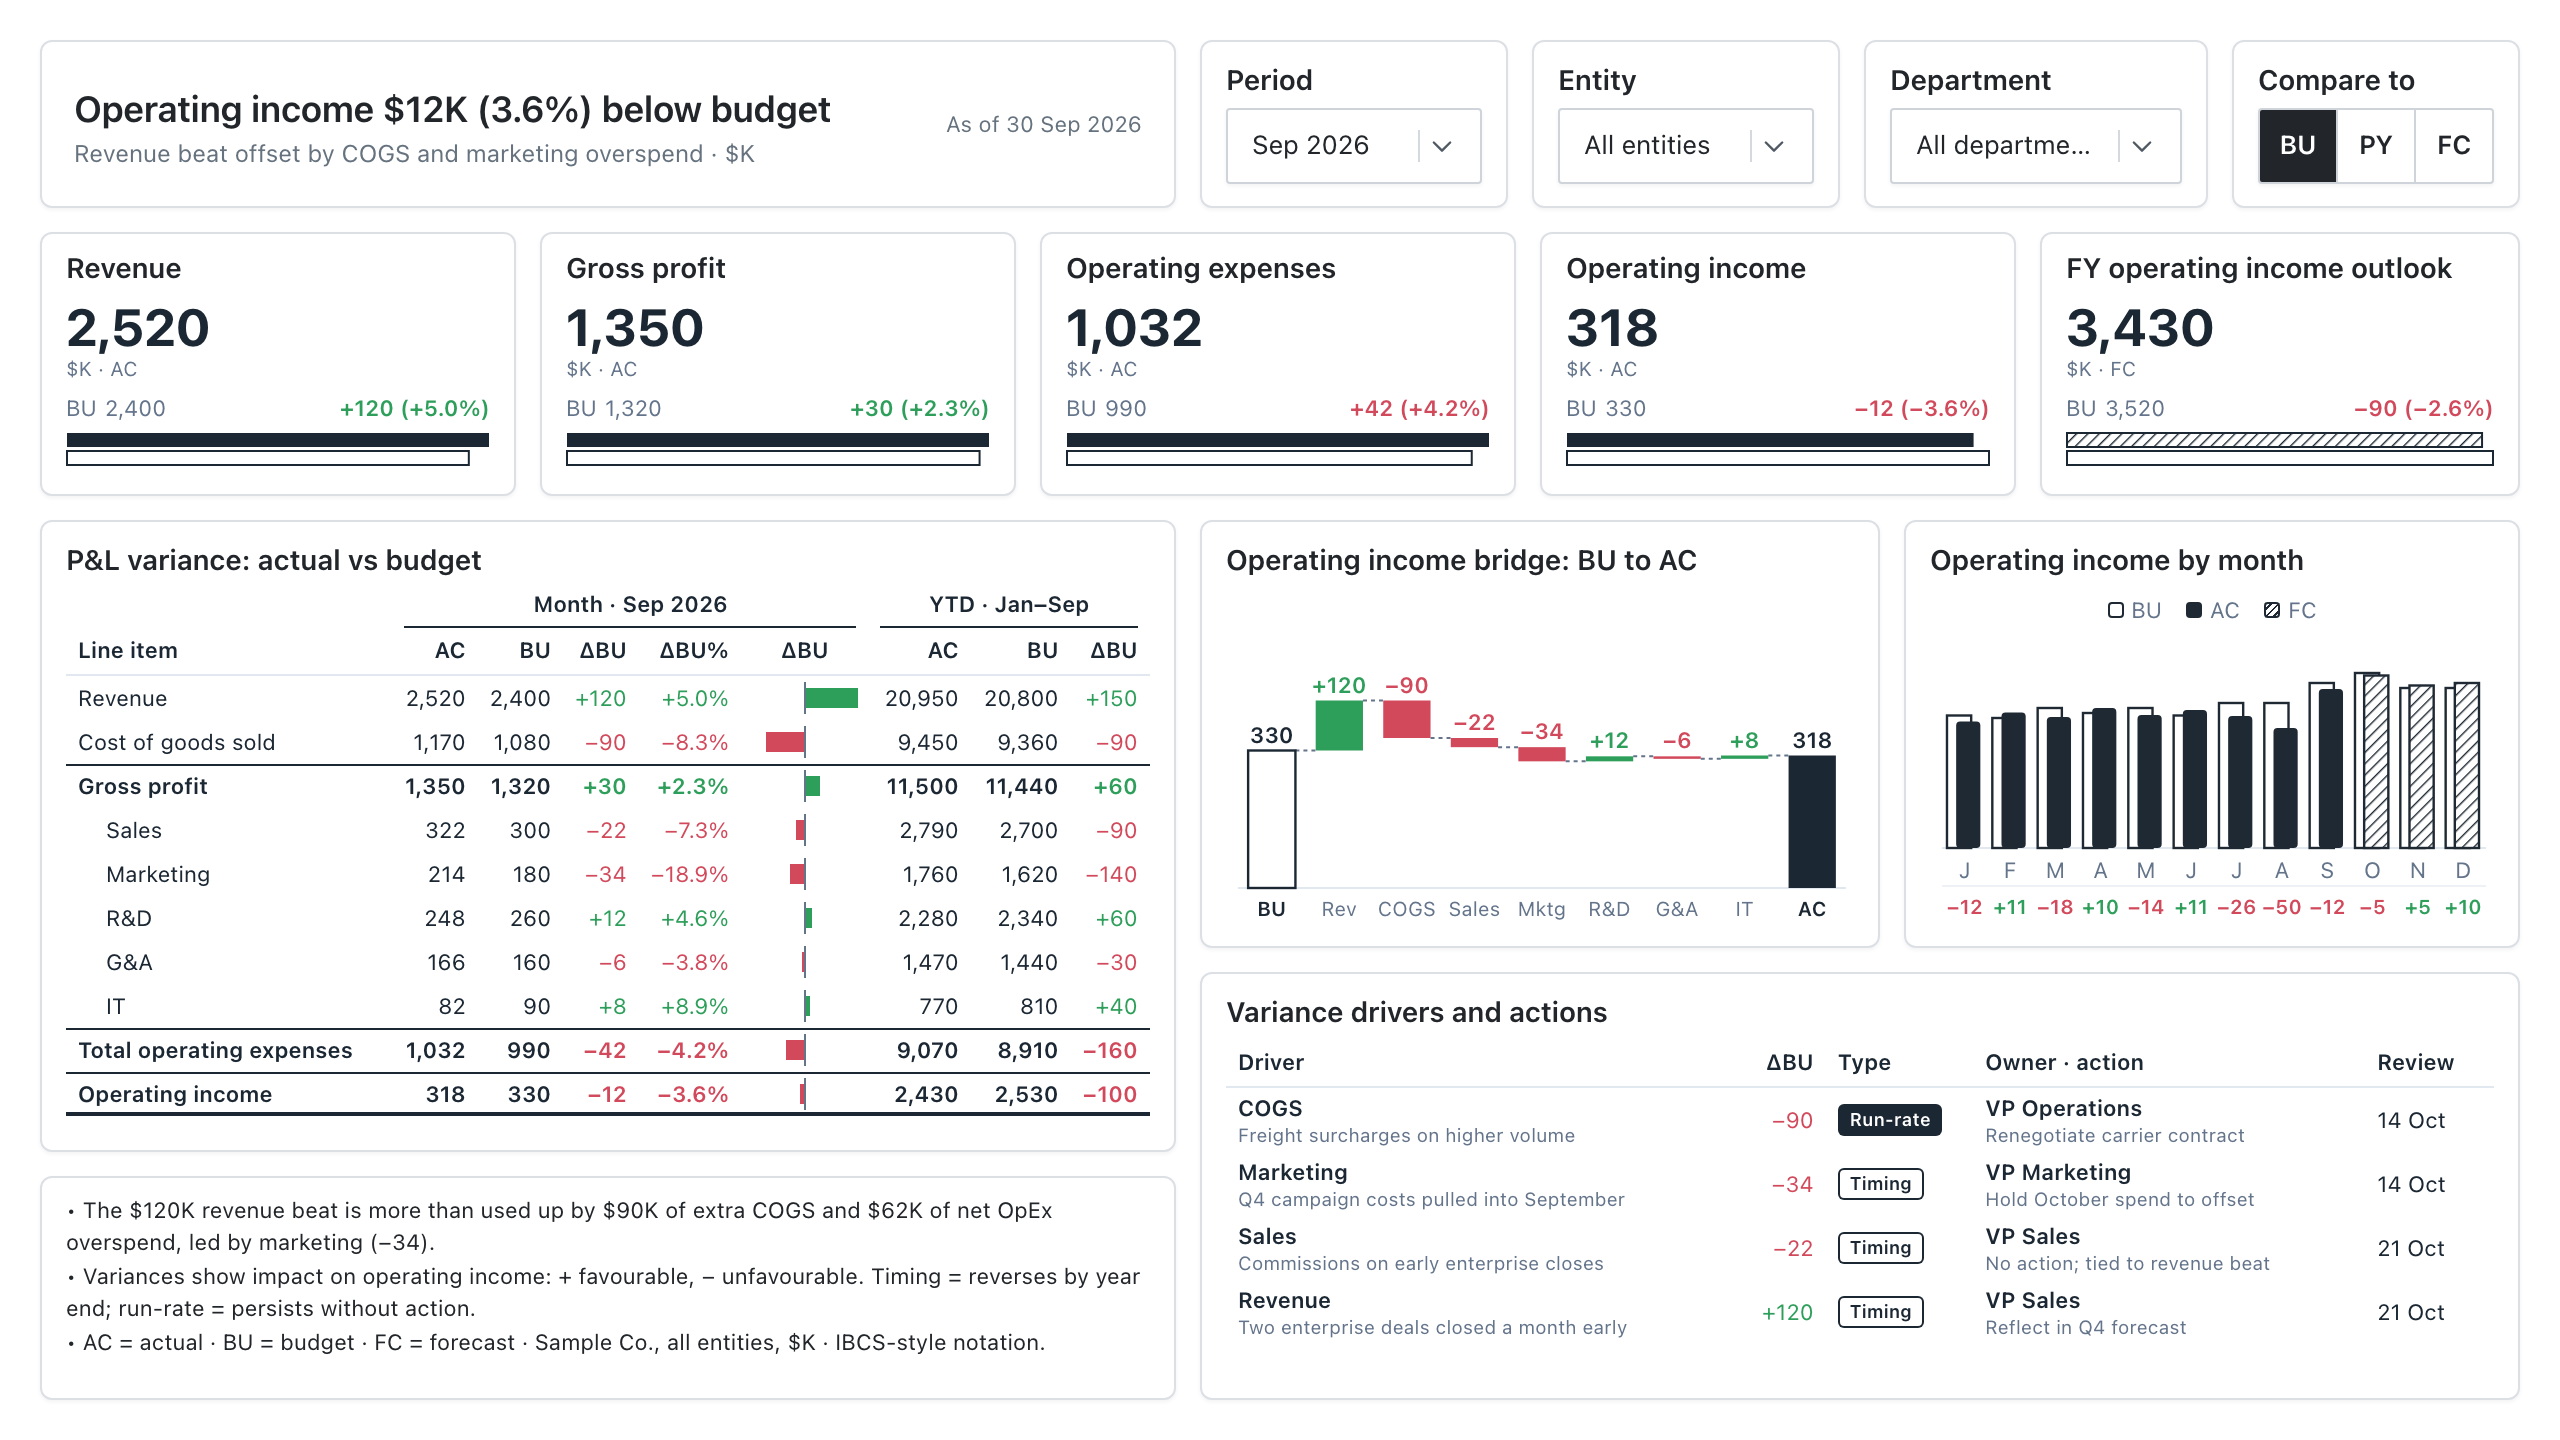
The Budget vs Actual Variance template is an IBCS-style monthly report for finance and FP&A teams to explain why operating income differs from budget and to decide which variances need action. It shows a headline finding, a P&L variance table for month and YTD, and an operating income bridge from budget to actual.
Click the mockup to open it full size
About this template
FinanceBuilt on IBCS notation, so actual, budget and forecast always look the same: actuals solid, budget outlined, forecast hatched, variances green or red. The headline states the finding, a P&L table shows month and YTD variances with subtotals, a waterfall bridges budget to actual, and a drivers table records whether each gap is timing or run-rate and who owns the fix.
Metrics this dashboard tracks
- Revenue, gross profit, opex & operating income vs. budget
- FY operating income outlook (forecast)
- P&L variance, month and YTD
- Operating income bridge (BU to AC)
- Monthly AC / FC vs. BU
- Variance drivers, owners and actions
What's on the Budget vs Actual Variance dashboard?
| Section | What it shows | Why it's here |
|---|---|---|
| Headline and filters Title card with subtitle; Period, Entity and Department dropdowns; Compare to toggle (BU, PY, FC) | A one-sentence finding ("Operating income $12K (3.6%) below budget"), the as-of date and the main causes, plus the controls that set period, entity, department and comparison scenario. | The reader gets the conclusion before any chart, and the controls let each budget owner re-cut the same report for their entity or department without asking finance for a new version. |
| KPI row Five KPI cards, each with a solid actual bar over an outlined budget bar | Revenue, gross profit, operating expenses and operating income as actual (AC) with budget (BU) and the variance in $K and %. The fifth card shows the full-year operating income outlook as forecast (FC) with a hatched bar. | Totals come first, so the reader knows how big the gap is before looking at lines. The outlook card tells them whether a month miss changes the full-year picture. |
| P&L variance table Table with Month and YTD column groups and an inline variance bar column | Revenue, cost of goods sold, gross profit, five operating expense lines, total operating expenses and operating income. Columns are AC, BU, variance and variance % for the month, then AC, BU and variance for YTD. Subtotals are set in bold with rules above them. | Every line is visible with its month and YTD gap, so a reader can find which lines are off and see whether a month variance is a one-off or part of a pattern. |
| Operating income bridge Waterfall chart | Operating income walks from the budget bar (BU, outlined) through revenue, COGS and each opex line, in green for favourable and red for unfavourable steps, to the actual bar (AC, solid). | It turns the total gap into ordered steps, so the reader can name the lines that explain it (here revenue up, COGS and marketing down) and know where to ask questions. |
| Operating income by month Column chart with a variance row underneath | Twelve months of actual (solid) against budget (outlined), with the remaining months as forecast (hatched). The variance for each month sits under the axis in green or red. | A single month's miss reads differently against the year. This view shows whether the gap is isolated or repeating, and how much of the year is still forecast. |
| Variance drivers and actions Drivers table | One row per material variance with the driver and its cause, the amount, a Timing or Run-rate tag, the owner with the action, and a review date. | It assigns each material variance a cause, an owner and a review date, so the meeting ends with who does what. The Timing and Run-rate tags show which gaps will reverse and which need action. |
| Commentary and legend Text box | Three short notes: the main variance in words, the sign convention and the Timing and Run-rate definitions, and the abbreviations AC, BU and FC. | The notes give the story in words and fix the sign convention, so a reader who skips the charts still reads the variances the right way round. |
What each metric means
IBCS notation (AC, BU, FC)
- Definition: A fixed visual code for scenarios. Actual (AC) is a solid fill, budget (BU) is an outline, forecast (FC) is hatched, and variances are green when favourable and red when adverse. Because the code never changes, a reader can tell the scenario without reading the legend.
- Why it matters: Consistent encoding lets a reader scan a page of charts and tables and see which numbers are real, planned or projected. IBCS is a published standard for business communication; the template follows its conventions in style.
Variance (ΔBU)
- Definition: The gap between actual and budget. The table shows it as impact on operating income, so a plus sign is favourable and a minus sign is unfavourable on every line.
- Formula:
Variance = Actual - Budget (revenue and profit lines). For cost lines, impact = Budget - Actual. - Why it matters: It shows where results departed from plan. Practice differs: some reports show raw actual minus budget on every line and then colour by favourable or adverse. This template flips the sign on cost lines so one sign rule applies everywhere.
Variance % (ΔBU%)
- Definition: The variance as a share of budget, which makes lines of different size comparable.
- Formula:
Variance % = Variance / Budget - Why it matters: A $34K overspend means more on a $180K marketing budget than on a $1,080K COGS budget. The percentage shows that at a glance.
Favourable and adverse variance
- Definition: Favourable means the gap improves operating income: revenue above budget or cost below budget. Adverse means it reduces operating income: revenue below budget or cost above budget.
- Why it matters: The same raw difference can be good or bad depending on whether the line is revenue or cost. Colour and sign must reflect impact, not just direction.
KPI cards: revenue, gross profit, operating expenses, operating income
- Definition: Month actuals for the four headline P&L lines, each with budget and variance. Gross profit is revenue minus cost of goods sold. Operating income is gross profit minus operating expenses.
- Formula:
Gross profit = Revenue - COGS; Operating income = Gross profit - Operating expenses - Why it matters: They give the reader the totals before the detail, so the table and bridge answer "why" rather than "what".
- Why a KPI card: A large number with budget and variance beside it can be read in a second, and the paired bars show the size of the gap. A table would give the same figures but bury the headline totals.
FY operating income outlook
- Definition: The full-year operating income expected from the latest forecast (FC), compared with full-year budget. It is shown hatched to mark it as a projection.
- Formula:
Outlook variance = Forecast full year - Budget full year - Why it matters: The month variance says what happened. The outlook says whether the year is still on plan, which is the question a CFO asks next.
- Why a KPI card: A single forecast figure with its budget gap fits a card. The hatched bar marks it as a projection, so it is not read as a closed result.
P&L variance table (month and YTD)
- Definition: The profit and loss statement with actual, budget, variance and variance % for the current month, and actual, budget and variance for year to date. The small bar beside each variance shows its size and direction.
- Why it matters: Month figures show what changed now. YTD figures show whether a month gap is noise or part of a pattern.
- Why a table: A table holds many lines and several measures in exact numbers, and finance readers expect to check totals. The small variance bars add the size and direction that figures alone make slow to scan.
Operating income bridge (budget to actual)
- Definition: A waterfall chart that starts at budgeted operating income, adds or subtracts the variance of each P&L line, and ends at actual operating income. The steps add up exactly to the total variance.
- Formula:
Actual operating income = Budget operating income + sum of line variances (as impact) - Why it matters: It shows which lines drove the result and by how much, in the order a reader would explain it. Waterfall charts are the standard form for this.
- Why a waterfall chart: Floating steps show each line adding to or taking from the running total, which a bar chart of variances cannot do. The reader sees the sequence from budget to actual and the size of each step.
Operating income by month
- Definition: Monthly operating income for the fiscal year: actual (solid) and budget (outlined) for closed months, forecast (hatched) for open months, with the monthly variance printed below.
- Why it matters: It shows whether the current gap is a one-off or a trend, and how the forecast compares with the plan for the rest of the year.
- Why a column chart: Columns on a shared monthly axis make it easy to compare actual with budget month by month and to see where forecast begins. A line chart would hide the paired comparison.
Variance drivers and actions
- Definition: A log of the material variances with a short cause, a type, an owner, an action and a review date. Timing means the variance reverses by year end. Run-rate means it persists unless someone acts.
- Why it matters: A number without an owner does not get fixed. Tagging each gap as timing or run-rate tells the reader which ones need action.
- Why a table: Each driver needs text for the cause, owner and action next to its amount. Rows with short labelled columns keep that readable, which a chart cannot do.
Data you need to build this
- General ledger or ERP (SAP, Oracle, NetSuite, Dynamics, or similar) Account or P&L line mapping (revenue, COGS, each opex line), Cost centre, department or business unit, Legal entity, Period (fiscal month and year), Scenario flag: AC (actual), Amount in a single reporting currency
- Budgeting or planning tool (Anaplan, Adaptive, Excel, or similar) Same account, cost centre, entity and period keys as the ledger, Scenario flag: BU (budget), Scenario flag: FC (latest forecast) for open months, Amount in the same currency and sign convention as actuals
- Finance team commentary (spreadsheet or form) Driver description, Variance amount, Type (timing or run-rate), Owner, Action, Review date
Why it's laid out this way
- The headline states the finding in a sentence, with the cause underneath, so a reader gets the answer before reading any chart.
- The KPI row gives totals, the table gives every line, and the waterfall shows which lines moved operating income, so detail follows the headline.
- The drivers table ends the page with an owner, an action and a review date for each material variance, so the report leads to decisions and not just numbers.
Further reading: IBCS (International Business Communication Standards)
Last updated:
More like this
Financial
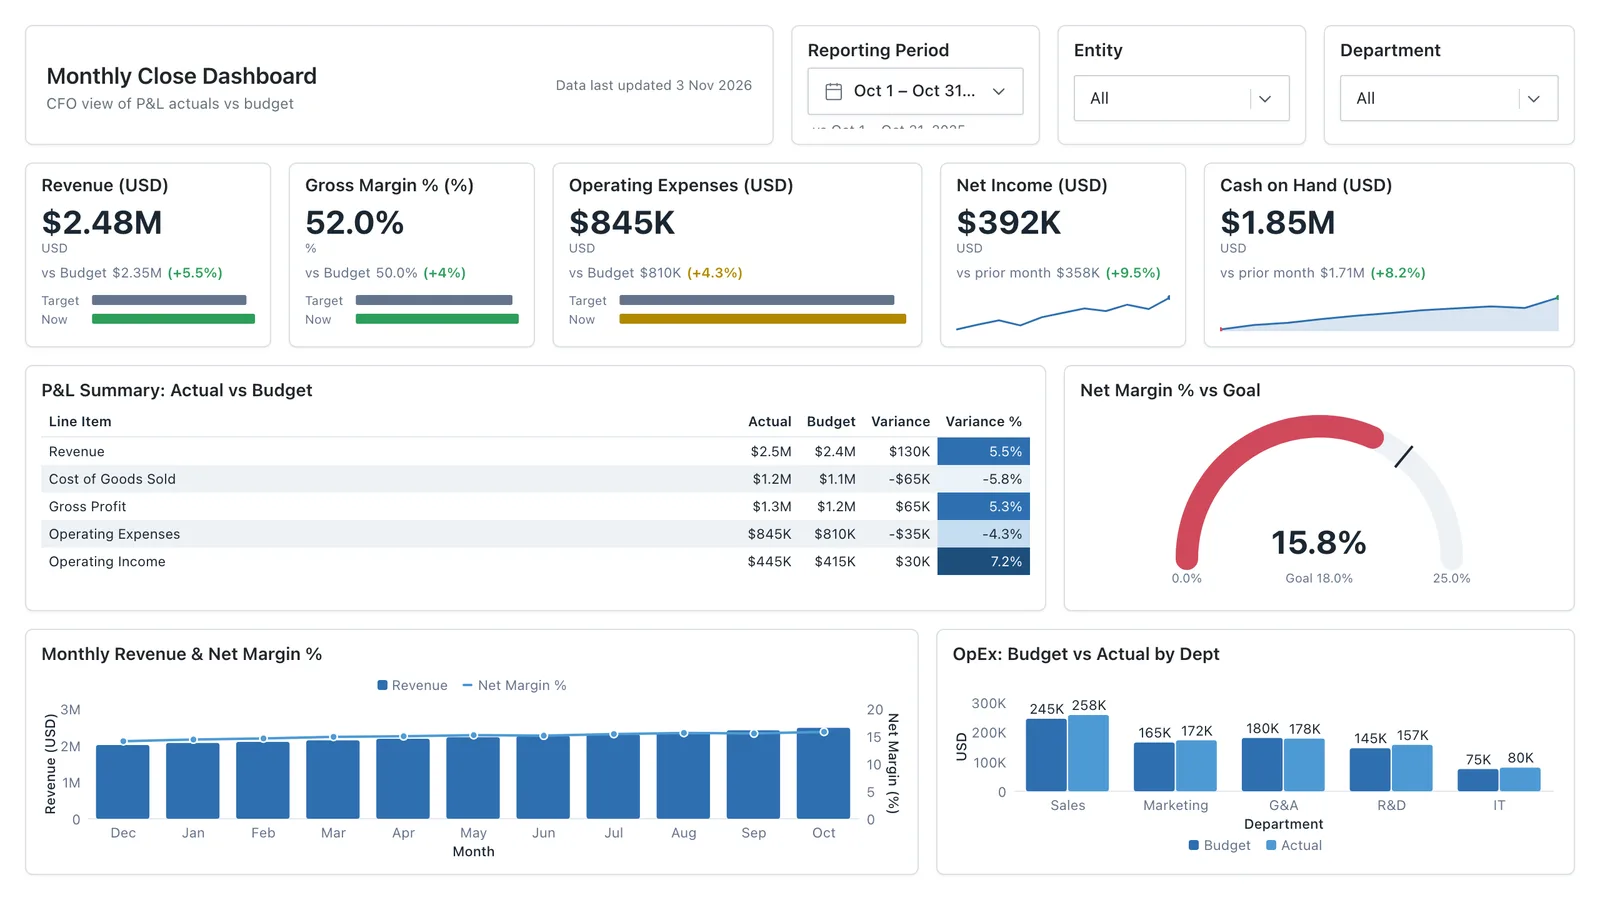
P&L summary, cash flow trends, budget vs actuals, and departmental spend, wireframed before a single DAX measure is written.
Sales Performance
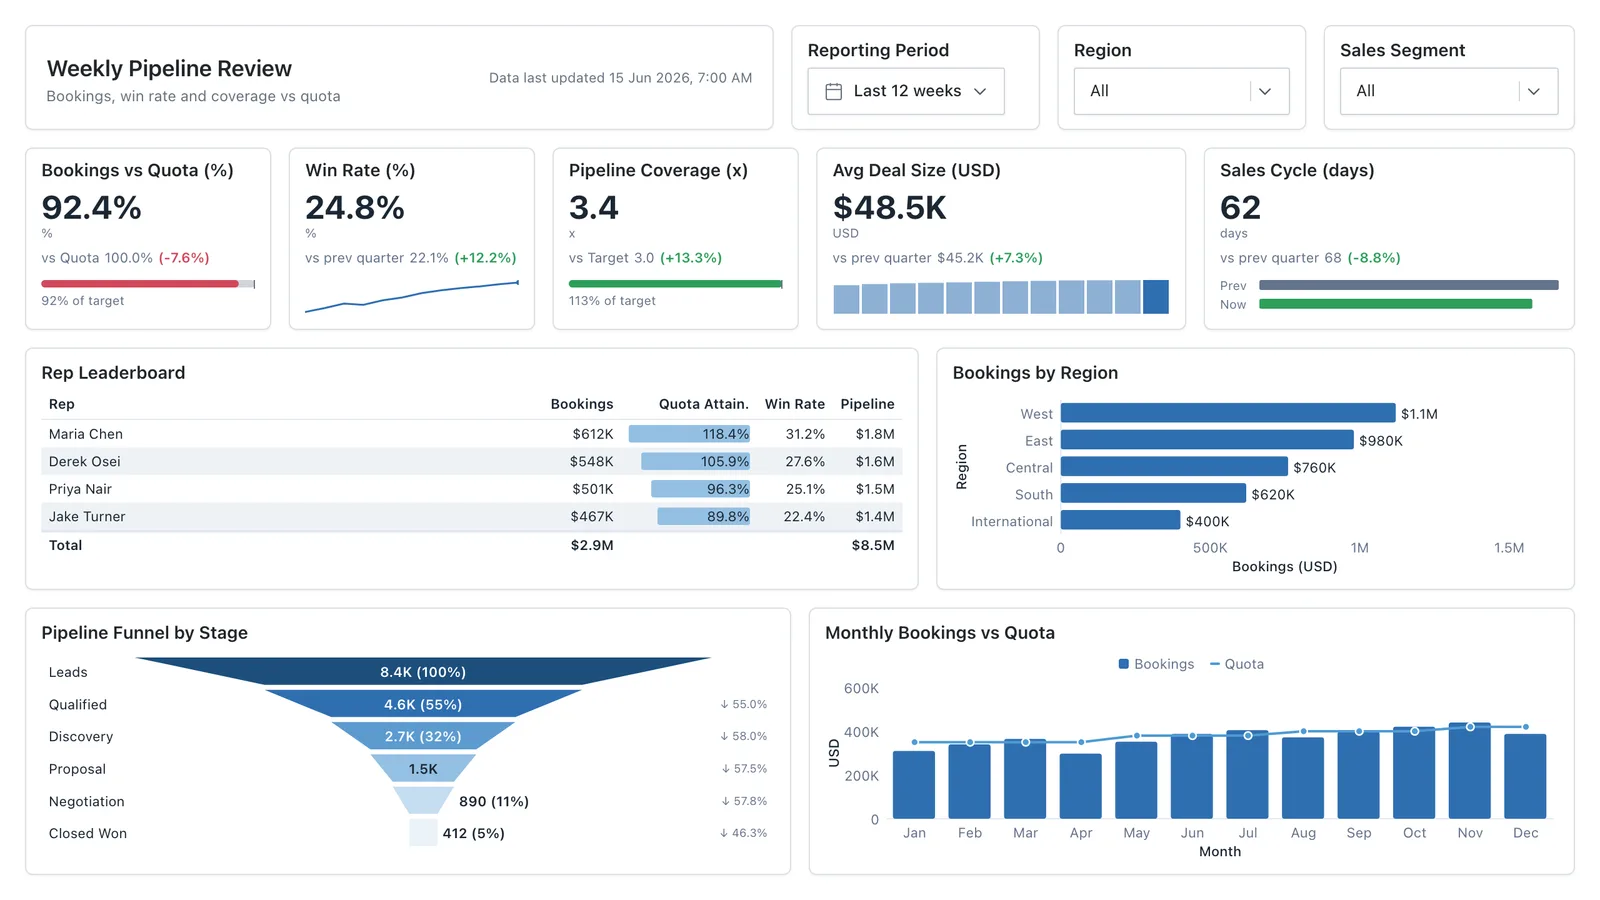
Revenue, win rate, pipeline value, and rep performance across regions — the layout most sales teams build first.
Sales Pipeline
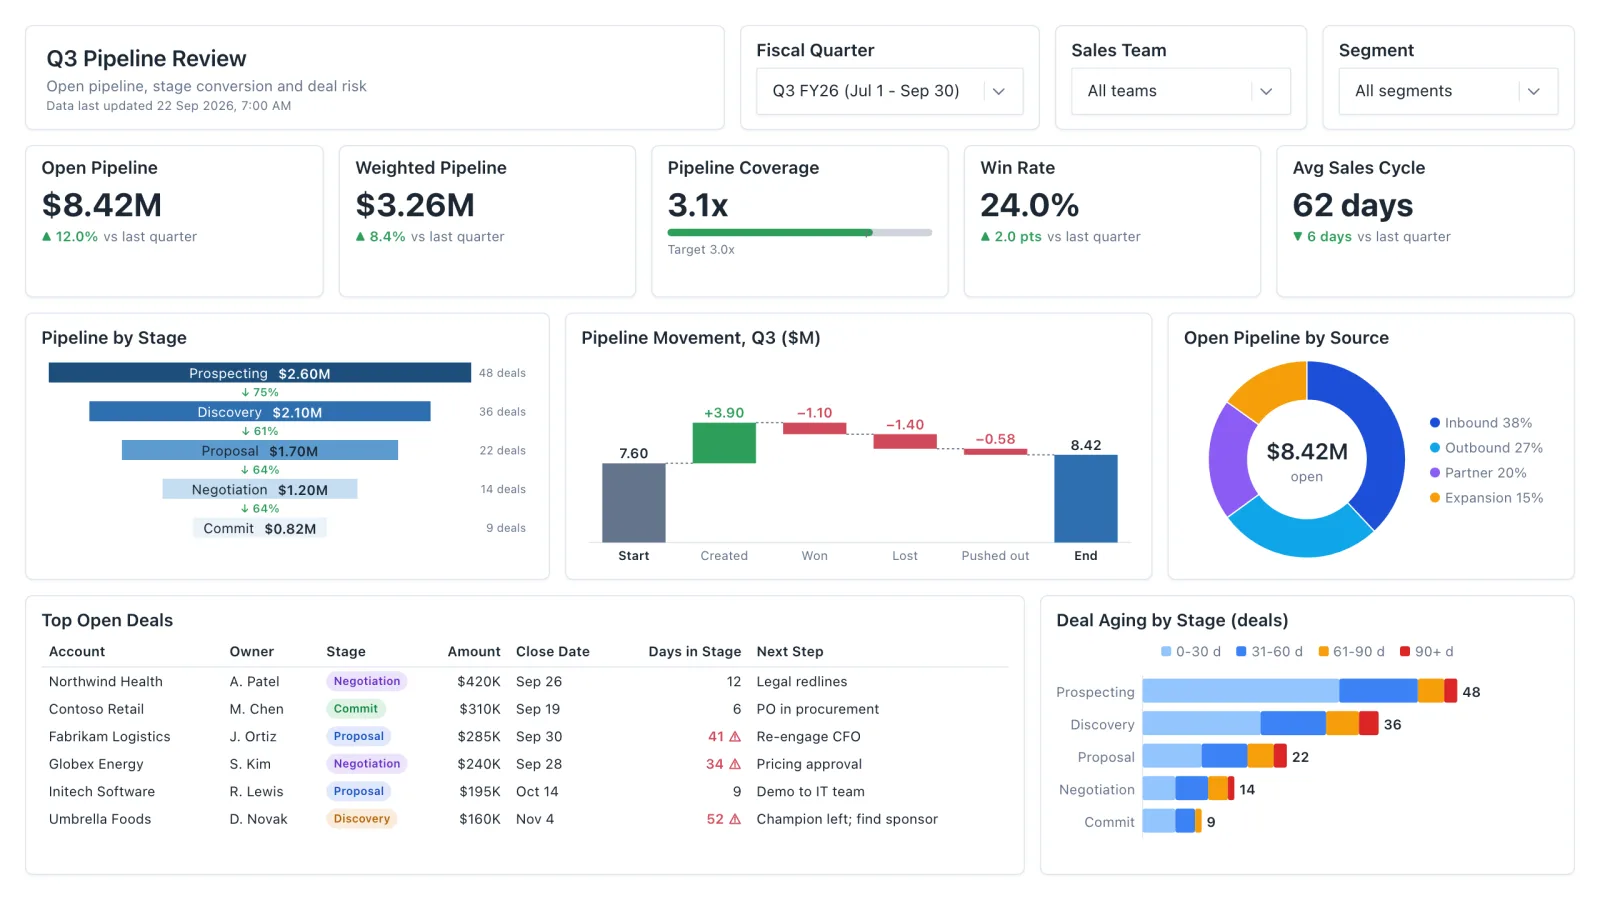
Sales pipeline dashboard with open and weighted pipeline, coverage vs target, a stage funnel and stale-deal flags.
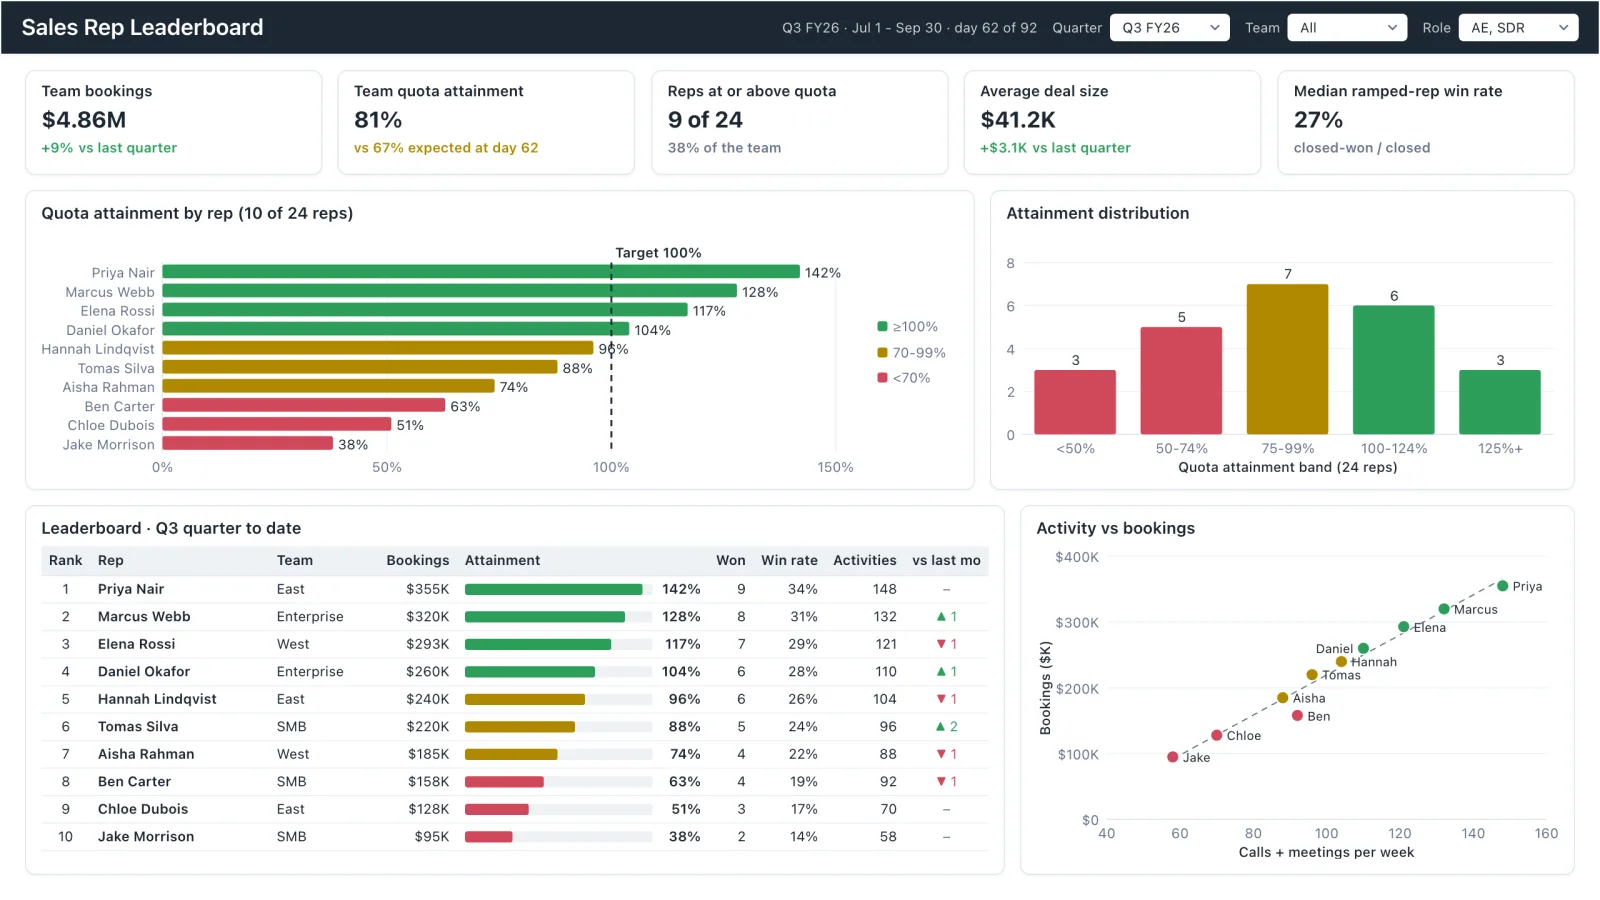
Sales Rep Leaderboard
Sales rep dashboard example with quota attainment by rep, a ranked leaderboard table and activity vs bookings.
Sales, finance, HR, SaaS, and more — filter by team or search by metric.