Customer Support Dashboard Mockup Template
The Customer Support dashboard template is a one-page operations layout for support managers and team leads, built to decide whether the team is meeting its response targets and how to spread work across agents and hours. It shows tickets logged and resolved, escalation rate, first response time, resolution time, agent workload and open tickets.
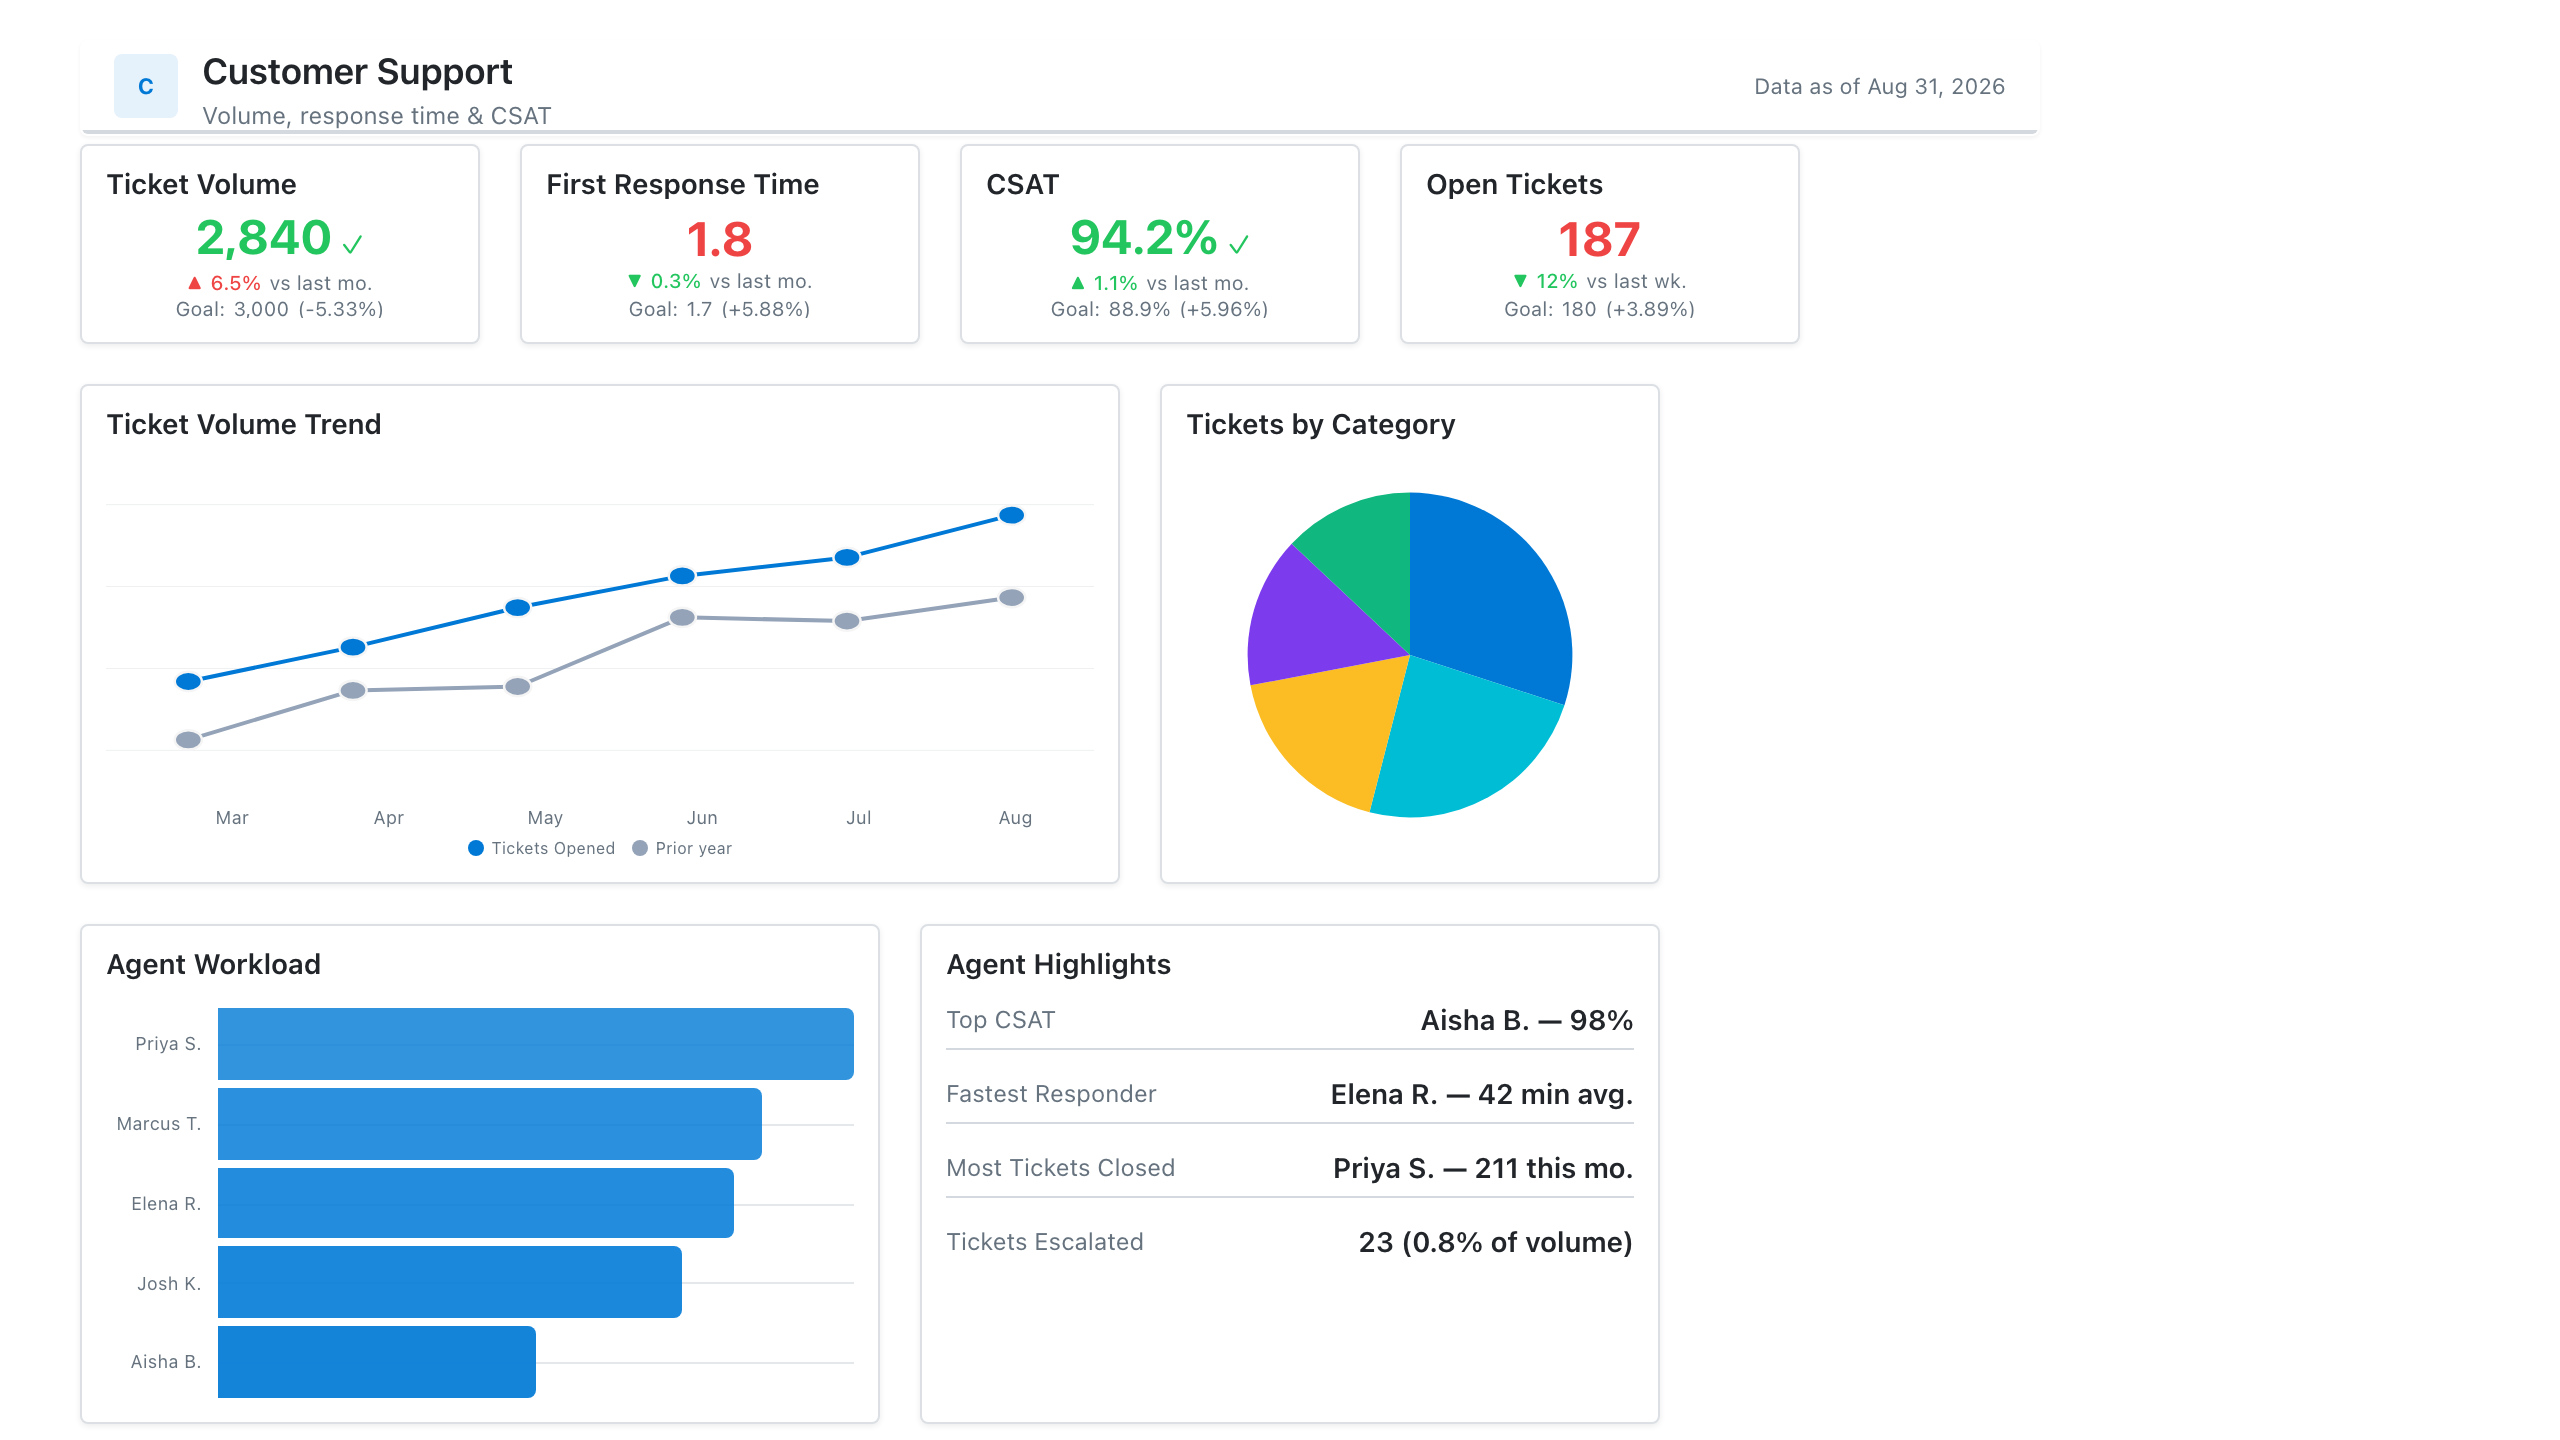
Click the mockup to open it full size
About this template
SupportA support-ops layout: ticket volume and SLA KPIs, a first-response-time trend, CSAT, and agent workload distribution. Wireframe it before building the real report off Zendesk or Intercom data.
Metrics this dashboard tracks
- Ticket volume & backlog
- First response & resolution time
- SLA attainment
- CSAT / CES
- Tickets by channel & category
- Agent workload
What's on the Customer Support dashboard?
| Section | What it shows | Why it's here |
|---|---|---|
| Header and filters Title card, three dropdown filters | The report title ("Support Ops Command Center"), a subtitle, a data last updated date, and filters for reporting period (Last 30 days), category and priority. | Confirms the period and data freshness, and lets a manager narrow the whole page to one category or priority before reading any number. |
| KPI row Five KPI cards, three with sparklines, one with a target bar | Tickets logged (1,842), tickets resolved (1,698), escalation rate (8.4%), first response time in minutes (12.5, with a bar comparing now with a 15-minute target) and average resolution time in minutes (145, against a 120-minute target), each with a change versus the previous period or the target. | Tells the manager at once whether volume is outpacing resolutions and whether response and resolution targets are met, so the rest of the page is read for causes. |
| Resolution and workload row Column chart, clustered column chart | A column chart of tickets by resolution time bucket (under 15 minutes, 15-30 minutes, 30-60 minutes, 1-4 hours, over 4 hours) with the count on each bar, beside a clustered column chart of tickets by agent (six agents) split by status: Assigned, In Progress, Escalated and Closed. | The distribution shows whether the average hides a long tail of slow tickets, and the agent chart shows whether open work is spread evenly or piled on a few people. |
| Demand and open ticket row Heatmap table, table | A heatmap of tickets logged by hour of day (8am to 4pm) and category (Software, Hardware, Network, Access, Billing) with row totals, beside a table of open tickets with ticket number, customer, category, priority, assigned agent and status. | The heatmap shows when each kind of demand peaks so staffing can follow it, and the table turns the page into a worklist of specific tickets to act on. |
What each metric means
Tickets logged
- Definition: The number of new tickets created in the period, across all channels that feed the help desk.
- Formula:
Tickets logged = count of tickets created in the period - Why it matters: It measures incoming demand, the number all staffing is planned against.
- Why a KPI card with sparkline: The number gives the total and the small line behind it shows the direction over the period.
Tickets resolved
- Definition: The number of tickets moved to a resolved or closed state in the period, regardless of when they were created.
- Formula:
Tickets resolved = count of tickets resolved in the period - Why it matters: Compared with tickets logged, it shows whether the backlog is growing or shrinking.
- Why a KPI card with sparkline: Placed beside tickets logged, the two cards can be compared in one glance, with the trend line showing direction.
Escalation rate
- Definition: The share of tickets passed from the first line of support to a specialist or higher tier. What counts as an escalation is a company decision, so define it on the report.
- Formula:
Escalation rate = escalated tickets / tickets logged - Why it matters: A high rate can signal gaps in agent training, documentation or the first-line scope.
- Why a KPI card with sparkline: A rate that changes slowly reads well as one percentage with a trend line behind it.
First response time
- Definition: The time from ticket creation to the first reply from a human agent. Automated acknowledgements are normally excluded, and some teams count only business hours. Report the average, the median or a percentile, and say which.
- Formula:
First response time = average of (first agent reply time - ticket created time) - Why it matters: Customers notice how long they wait for a first answer, and it is the most common support target.
- Why a KPI card with target bar: A bar for the target beside a bar for the current value shows the size of the gap, which the figure alone does not.
Average resolution time
- Definition: The average time from ticket creation to resolution. Teams differ on whether time spent waiting for the customer is excluded and on whether business hours are used.
- Formula:
Average resolution time = average of (resolved time - created time) for resolved tickets - Why it matters: It shows how long customers wait for a fix, and when it exceeds target it points to a process problem.
- Why a KPI card: One figure in minutes with its comparison to target is enough to see whether the team is inside its goal.
Resolution time distribution
- Definition: The number of resolved tickets in each resolution time bucket, from under 15 minutes to over 4 hours.
- Formula:
Bucket count = number of resolved tickets whose resolution time falls in the bucket - Why it matters: An average can look healthy while a few very slow tickets hurt customers, and the buckets expose that tail.
- Why a column chart: Ordered time buckets on the horizontal axis with counts on each column show the shape of the distribution directly.
Tickets by agent and status
- Definition: For each agent, the number of tickets in each status: Assigned, In Progress, Escalated and Closed.
- Why it matters: It shows how work is spread across agents and who holds the open and escalated tickets.
- Why a clustered column chart: Side-by-side columns per agent allow the status counts of each person to be compared directly.
Tickets logged by hour and category
- Definition: The number of tickets created in each hour of the day for each category, with an hourly total.
- Formula:
Cell value = count of tickets created in that hour with that category - Why it matters: It shows when each type of demand peaks, which guides shift planning and staffing by skill.
- Why a heatmap table: Shading cells by volume makes the busiest hour and category pairs visible faster than reading the grid of numbers.
Open ticket details
- Definition: A list of tickets that are not yet resolved, with ticket number, customer, category, priority, assigned agent and status.
- Why it matters: It gives a manager the specific tickets behind the totals, so urgent or escalated ones can be chased.
- Why a table: Each ticket has several attributes that must be read together, which a table lays out in columns.
Data you need to build this
- Help desk platform (Zendesk, Intercom, Freshdesk, Jira Service Management or similar), ticket object Ticket ID, Customer, Category, Priority, Channel, Assignee, Status, Created time, First agent reply time, Resolved time, Escalated flag
- Ticket status history or audit log Ticket ID, Status, Changed time, Assignee at change
- SLA policy table Priority, First response target, Resolution target, Business hours calendar
Why it's laid out this way
- The five KPI cards come first. The three volume and escalation cards carry sparklines for direction, while the two time cards show a target bar or a change against target, because for those the question is whether the goal is met.
- The middle row separates two questions. The resolution time columns on the left show how long tickets take, and the agent chart on the right shows who holds the work, so a slow tail can be matched to workload.
- The bottom row pairs demand with action. The heatmap of hour by category shows when to staff up, and the open ticket table beside it lists the specific tickets that need an owner.
Last updated:
More like this
Sales Performance
Revenue, win rate, pipeline value, and rep performance across regions — the layout most sales teams build first.
Sales Pipeline
Sales pipeline dashboard with open and weighted pipeline, coverage vs target, a stage funnel and stale-deal flags.
Sales Rep Leaderboard
Sales rep dashboard example with quota attainment by rep, a ranked leaderboard table and activity vs bookings.
Marketing Analytics
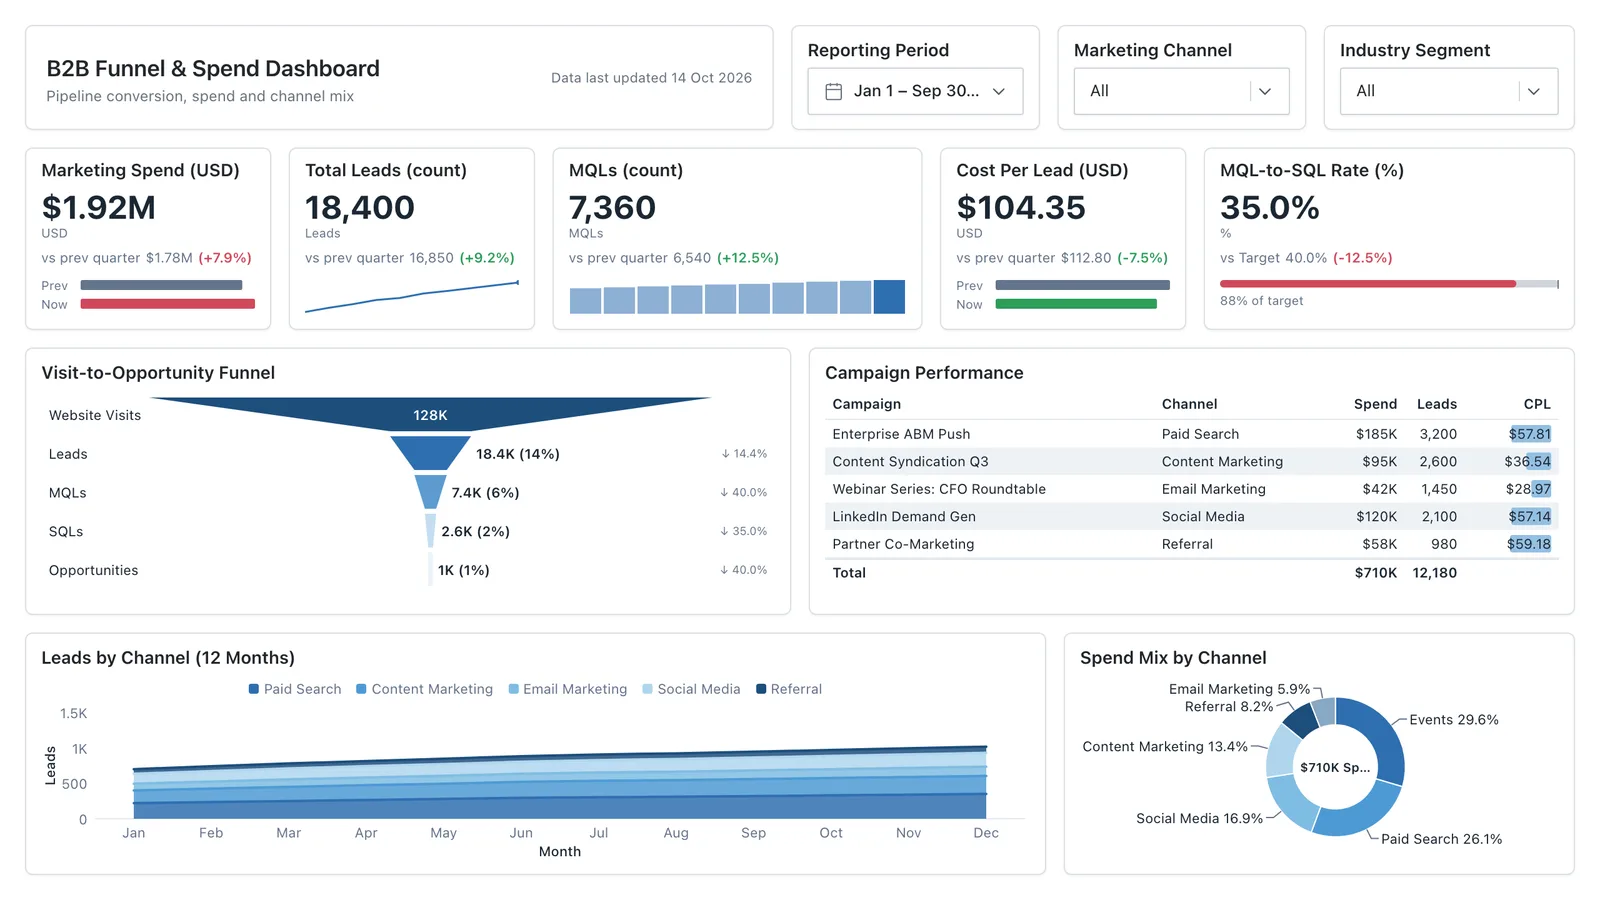
Campaign spend, traffic sources, conversion funnel, and lead volume in one wireframe.
Sales, finance, HR, SaaS, and more — filter by team or search by metric.