Project Delivery Dashboard Mockup Template
The Project Delivery dashboard template is a one-page status layout for PMO leads and delivery managers, built to decide which portfolios are slipping and which blockers need escalation this week. It shows on-time delivery rate, sprint velocity, open blockers, resource utilization, cycle time and project status by portfolio.
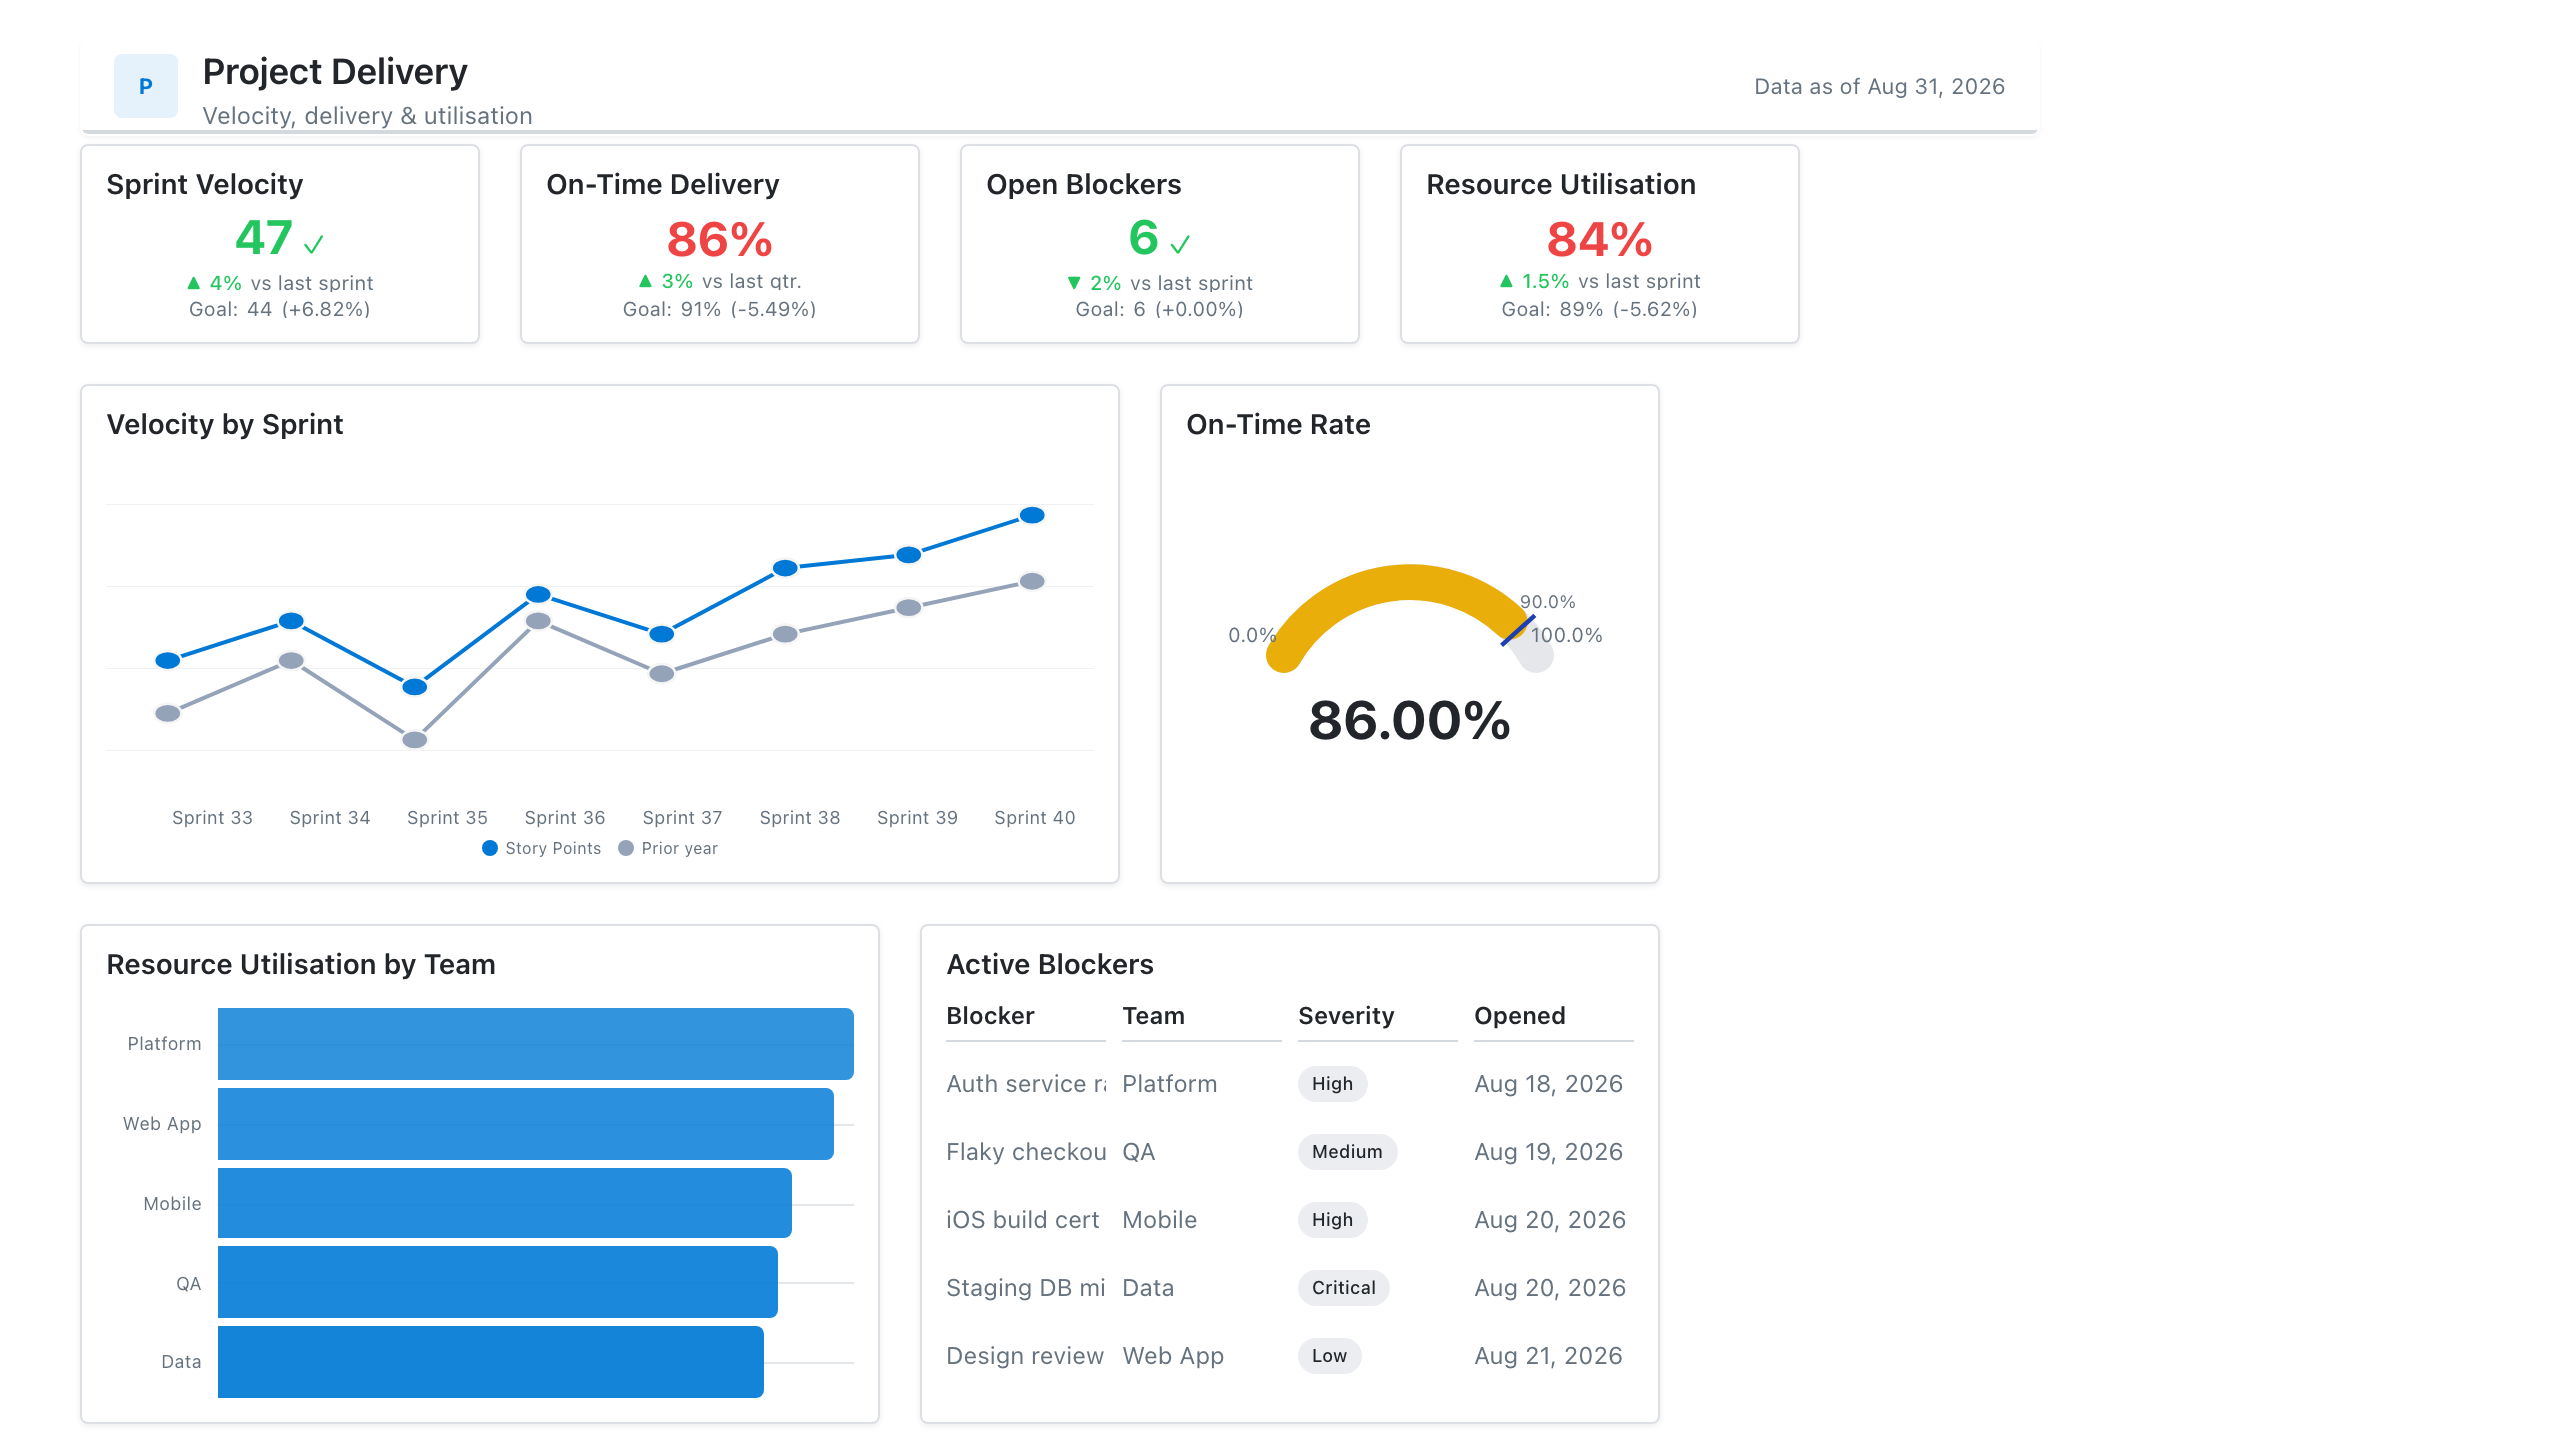
Click the mockup to open it full size
About this template
OperationsA delivery-team status layout: on-time delivery and velocity KPIs, a project status table, an open-blockers list, and resource utilisation. Built for the internal weekly delivery review and portfolio roll-ups.
Metrics this dashboard tracks
- On-time delivery rate
- Sprint velocity
- Open blockers / risks
- Resource utilisation
- Project status (RAG)
- Scope change
What's on the Project Delivery dashboard?
| Section | What it shows | Why it's here |
|---|---|---|
| Header and filters Title card, date range picker, two dropdown filters | The report title ("Project Delivery Status Dashboard"), a subtitle, a data last updated date, a date range (Jan 1 to Mar 31, 2026) with its comparison period (Oct 1 to Dec 31, 2025), and filters for portfolio and project status. | Fixes the reporting period and its comparison period up front, so every change shown below is read against the same baseline, and lets one page cover any portfolio. |
| KPI row Five KPI cards | On-time delivery rate (87.4%), sprint velocity in story points (342), open blockers and risks (23), resource utilization (91.2%) and average cycle time in days (6.8), each with a change versus the previous quarter or sprint, colored green or red. | Gives the delivery health in five numbers before any chart is read, and the red change on open blockers shows at once that the one metric getting worse is the one to ask about. |
| Velocity and on-time delivery row Line chart, gauge chart | A line chart of sprint velocity in story points across Sprint 1 to Sprint 12, one line per portfolio (Digital Transformation, Customer Experience, Data & Analytics, Infrastructure Modernization), beside a gauge of on-time delivery rate (87.4%) on a 0 to 100% scale against a 90% target. | The trend shows whether each portfolio is speeding up or stalling, and the gauge shows how far the overall on-time rate sits from its target, so the reader knows if the gap is a one-sprint dip or a pattern. |
| Status and blocker row Heatmap table, table | A project status table with portfolios as rows and On Track, At Risk and Delayed as columns (darker cells for higher project counts, 49 projects in total), beside an open blockers list with project, portfolio, blocker, days open and severity. | Shows which portfolio carries the at-risk and delayed projects, then names the specific blockers behind them, so the review ends with owners and actions rather than only a status count. |
What each metric means
On-time delivery rate
- Definition: The share of projects, milestones or work items delivered on or before their planned date in the period. Companies differ on the unit counted and on whether a re-baselined date counts as on time, so state which rule your report uses.
- Formula:
On-time delivery rate = items delivered on or before planned date / items delivered in the period - Why it matters: It is the headline measure of whether the delivery organisation keeps its commitments.
- Why a KPI card: A single percentage with a change versus the previous quarter is what a status review reads first.
On-time delivery rate versus target
- Definition: The same on-time delivery rate shown on a 0 to 100% scale with the target (90% on this layout) marked, so the distance to target is visible.
- Why it matters: A rate on its own does not say whether it is good enough. The target turns it into a pass or a gap.
- Why a gauge chart: A gauge suits one value that has a fixed range and a target, which is the case for a percentage with a goal.
Sprint velocity
- Definition: The number of story points a team completes in one sprint. Story points are estimated by each team, so velocity is best compared with the same team over time, not across teams with different estimating habits.
- Formula:
Sprint velocity = sum of story points for items completed in the sprint - Why it matters: It shows the pace a team can sustain, which is the basis for forecasting how much work fits in future sprints.
- Why a KPI card: The card shows the latest sprint total with its change versus the previous sprint, which is how velocity is usually discussed.
Sprint velocity trend by portfolio
- Definition: Velocity for each sprint plotted as one line per portfolio, so the pace of each portfolio is visible over twelve sprints.
- Why it matters: One sprint is noisy. Several sprints show whether the pace is rising, flat or falling.
- Why a line chart: Lines over an ordered sequence of sprints make the direction and the gaps between portfolios easy to follow.
Open blockers and risks
- Definition: The count of unresolved issues and risks that are stopping or threatening project work. Teams differ on whether a risk that has not yet happened counts as a blocker, so define the two terms in the report.
- Formula:
Open blockers = count of blocker and risk records with status open - Why it matters: Blockers are the most direct cause of delay, so a rising count is an early warning before delivery dates slip.
- Why a KPI card: A count with a red increase draws the eye to the one KPI on the row that is moving the wrong way.
Resource utilization
- Definition: The share of available working time that is allocated to project work. Calculations vary: some use billable hours, others planned or logged hours, and capacity may or may not net out leave. A very high rate leaves no slack for unplanned work.
- Formula:
Resource utilization = hours worked or allocated on projects / available hours - Why it matters: It shows whether the team is overloaded or underused, which affects both delivery risk and cost.
- Why a KPI card: One percentage compared with the previous quarter is enough, since the useful action is to ask whether capacity is too tight.
Average cycle time
- Definition: The average number of days a work item takes from the moment work starts to the moment it is done. Some teams start the clock at creation, which is closer to lead time, so say which one is used.
- Formula:
Average cycle time = average of (done date - start date) for completed items - Why it matters: It shows how quickly work flows through the team, and a falling number suggests less waiting between steps.
- Why a KPI card: A single figure in days with a green decrease shows at a glance that work is moving faster.
Project status by portfolio
- Definition: The count of projects in each status (On Track, At Risk, Delayed) for each portfolio, with row and column totals. How a project earns each status is a company rule, often set by schedule, budget and risk checks.
- Formula:
Cell value = count of projects in the portfolio with that status - Why it matters: It shows where the trouble sits and how big it is relative to each portfolio.
- Why a heatmap table: Shading cells by count lets the reader find the portfolio with the most at-risk or delayed projects without reading every number.
Open blockers list
- Definition: A row for each open blocker with the project, portfolio, blocker description, number of days it has been open and its severity (such as Critical or High).
- Why it matters: It names what is stuck and for how long, so someone can be asked to resolve it.
- Why a table: Each blocker has several attributes that must be read together, which a table lays out in columns.
Data you need to build this
- Project or portfolio management tool (Jira, Azure DevOps, Asana, Smartsheet or similar) Project ID, Project name, Portfolio, Status (on track, at risk, delayed), Planned delivery date, Actual delivery date, Work item start date, Work item done date, Sprint, Story points completed
- Risk and issue register Blocker or risk ID, Project, Description, Opened date, Status, Severity, Owner
- Resource planning or timesheet system Person, Project, Allocated or logged hours, Available hours, Period
- Targets sheet Portfolio, On-time delivery target, Comparison period
Why it's laid out this way
- The five KPI cards sit directly under the filters so the overall health of the portfolio is read first. Each carries a colored change versus the prior period, which makes the red open blockers card stand out.
- The middle row pairs the velocity trend with a gauge so the reader sees pace over time on the left and the on-time rate against its 90% target on the right, which are the two questions a delivery review asks first.
- Detail sits at the bottom. A heatmap of status counts by portfolio is beside the blockers table, so the portfolio with the darkest at-risk and delayed cells can be matched to the named blockers behind it.
Last updated:
More like this
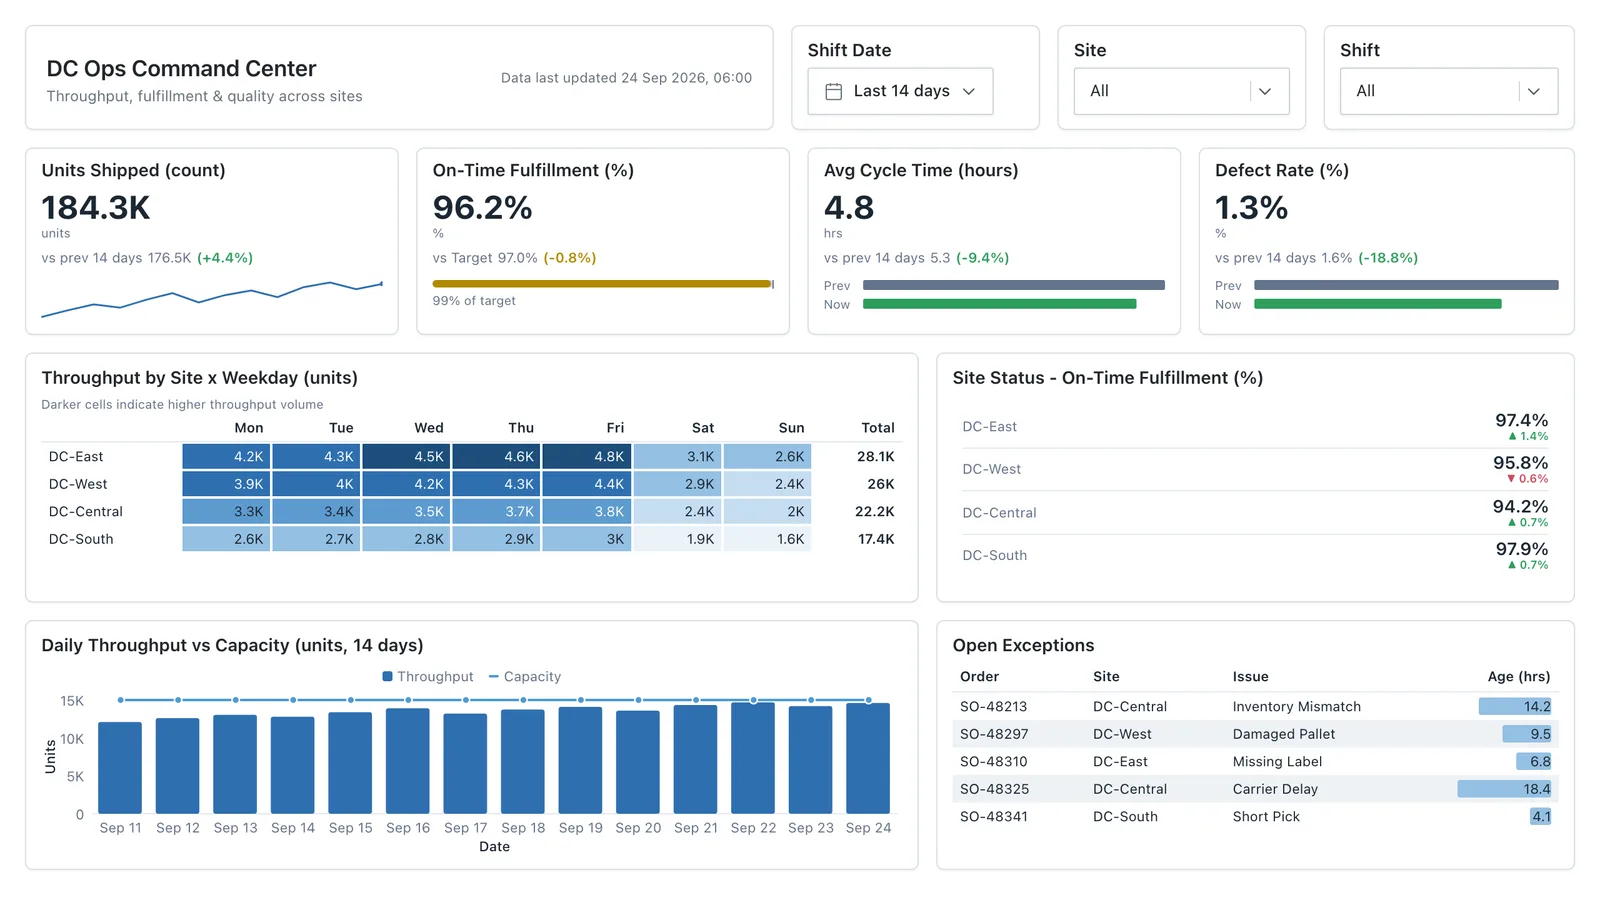
Operations Overview
Throughput, SLA attainment, backlog, and process-cycle time for an operational reporting layout leadership can scan at a glance.
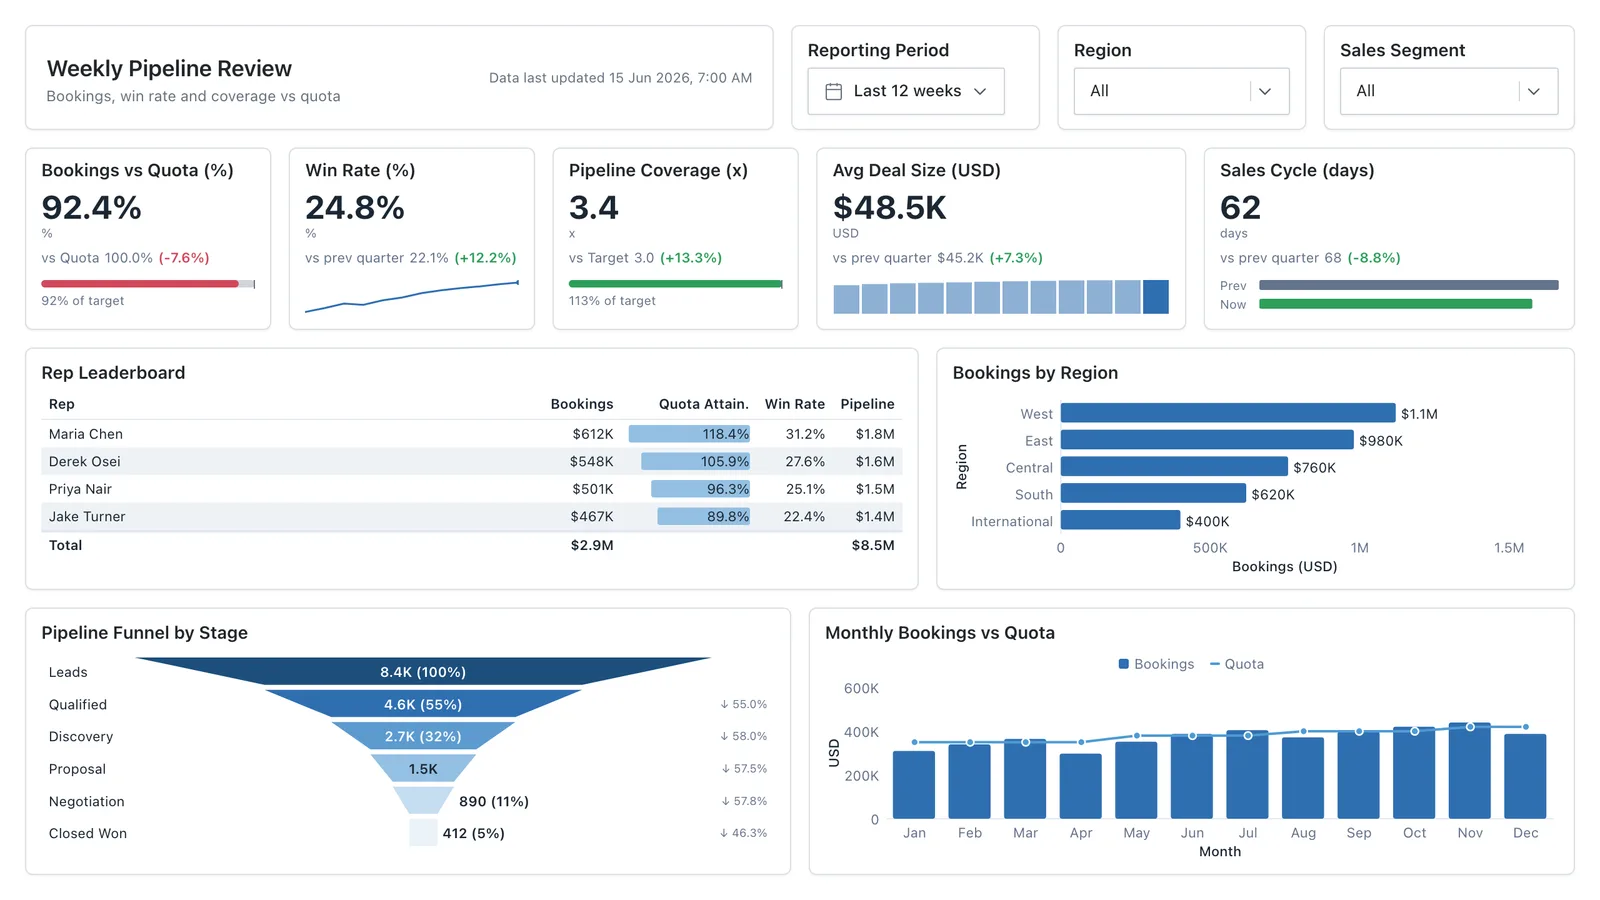
Sales Performance
Revenue, win rate, pipeline value, and rep performance across regions — the layout most sales teams build first.
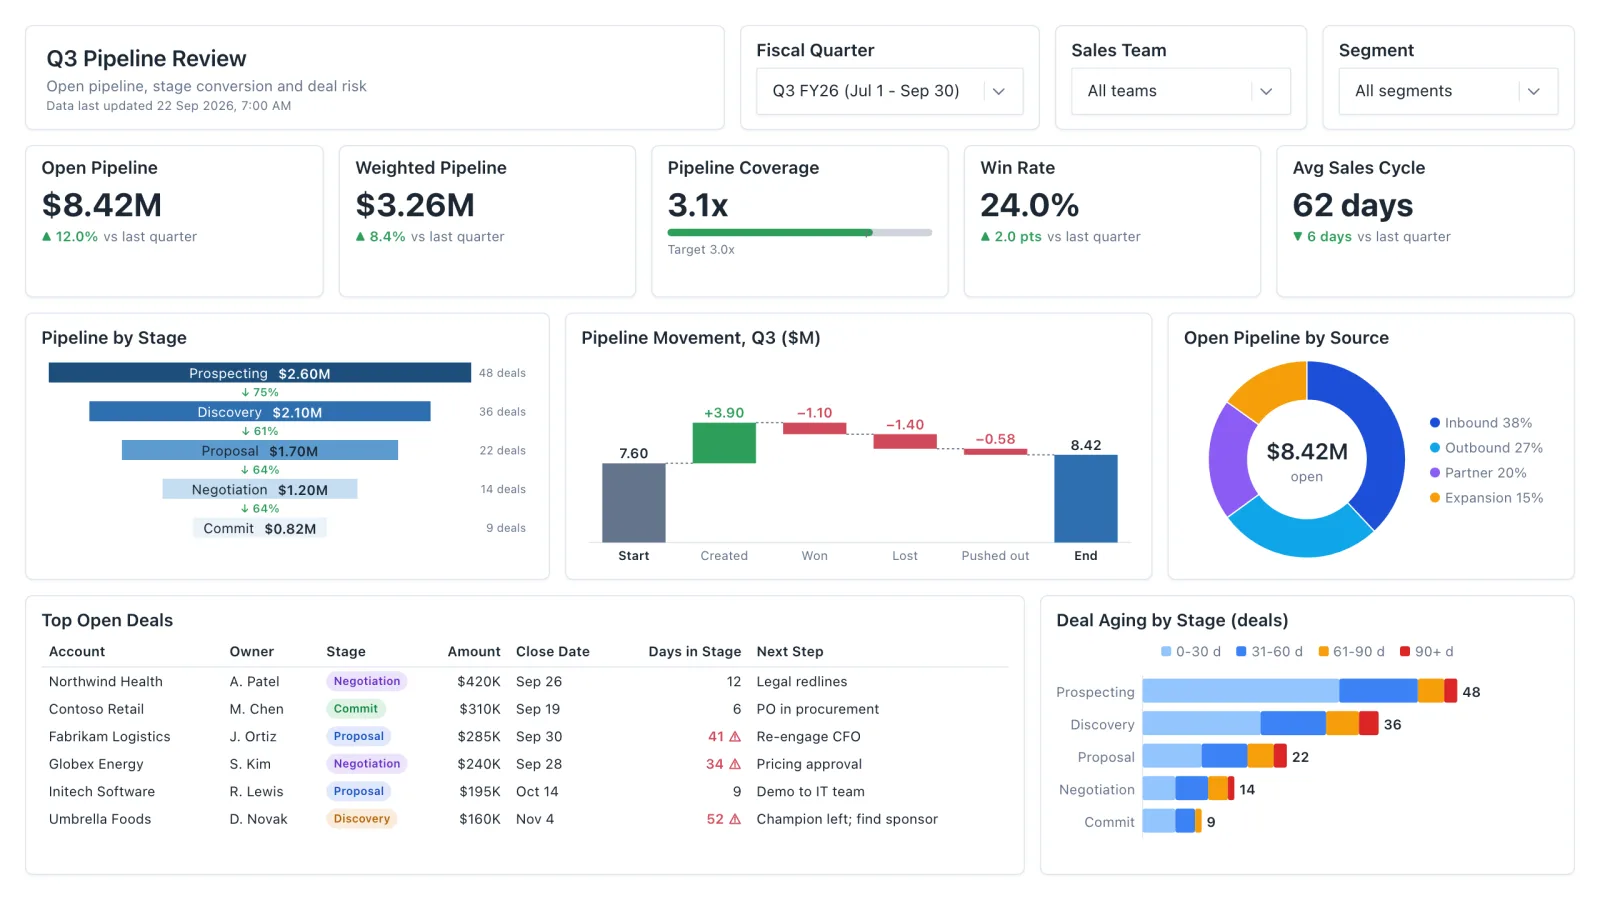
Sales Pipeline
Sales pipeline dashboard with open and weighted pipeline, coverage vs target, a stage funnel and stale-deal flags.
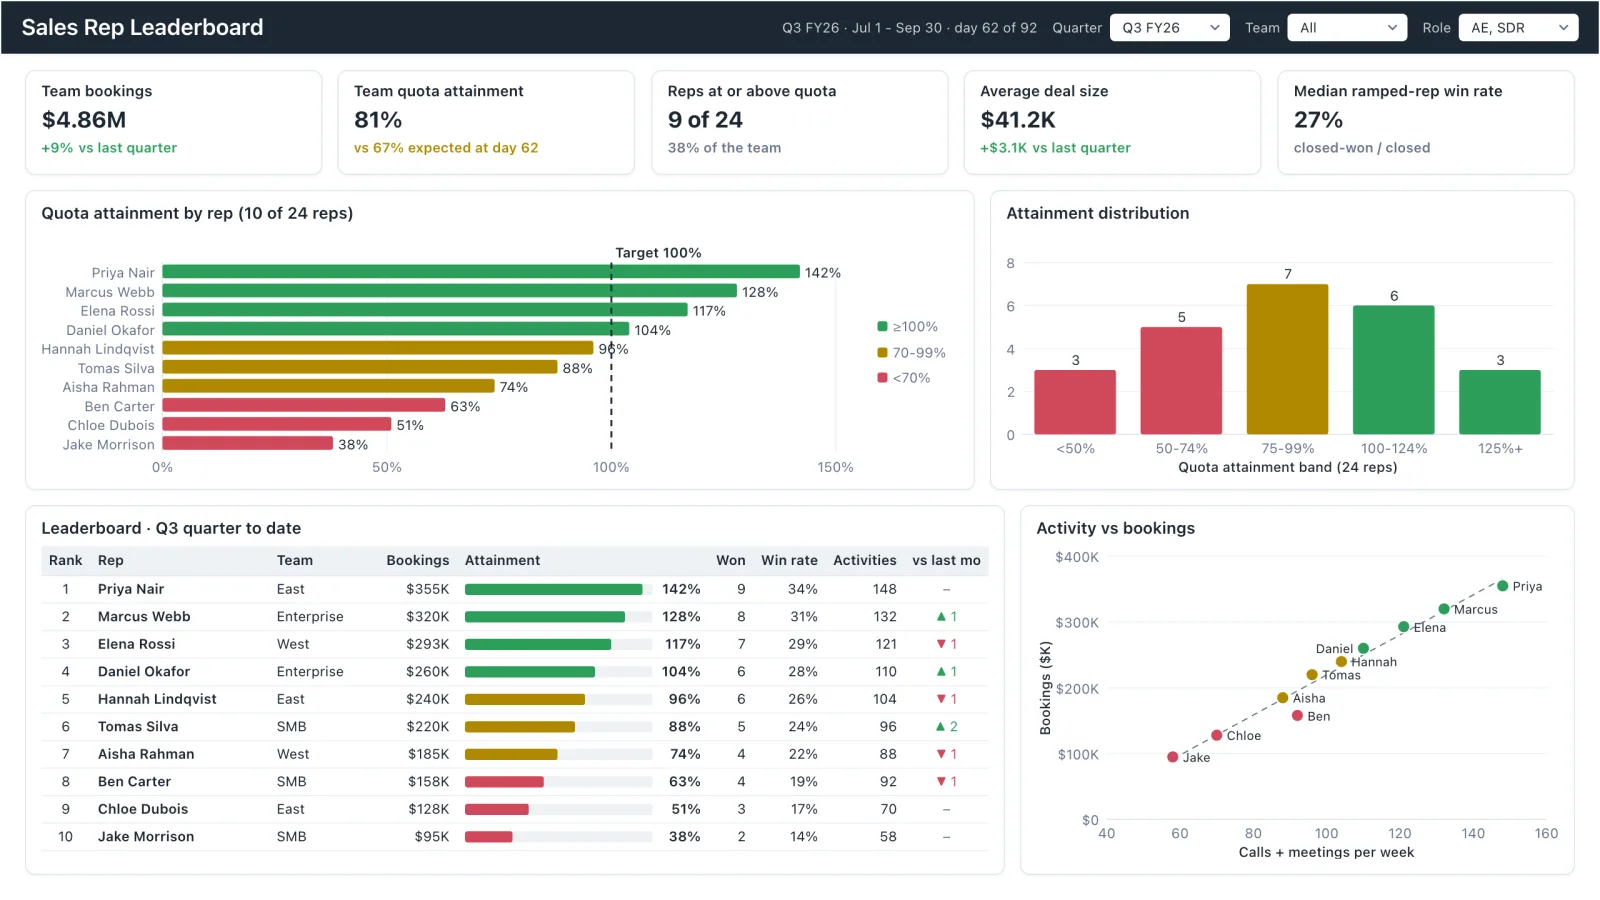
Sales Rep Leaderboard
Sales rep dashboard example with quota attainment by rep, a ranked leaderboard table and activity vs bookings.
Sales, finance, HR, SaaS, and more — filter by team or search by metric.