What cardinality tells you
A relationship links a column in one table to a column in another. Cardinality says how many rows can match on each side. Get it wrong and filters misbehave: totals double, slicers do nothing, or visuals show blanks.
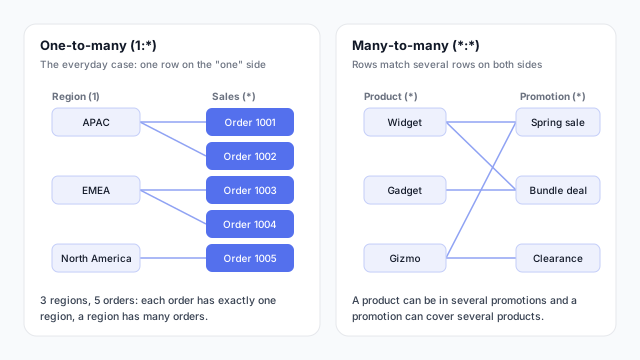
The picture above shows the two cases you’ll meet most. On the left, each of three regions has several orders, but every order belongs to exactly one region. That’s one-to-many. On the right, products and promotions both repeat on each side: Widget can be in two promotions, and a promotion can include several products. That’s many-to-many.
The types
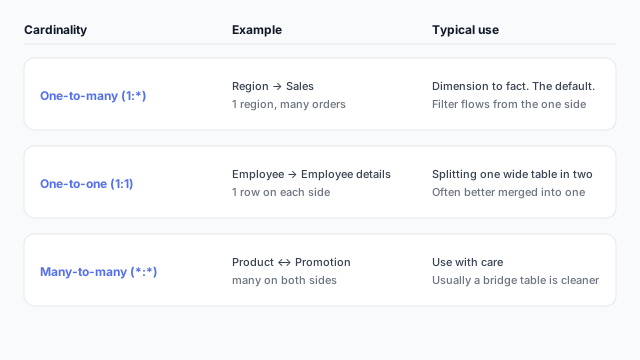
- One-to-many (1:*): the default. One row in a dimension matches many in a fact table. In Power BI the “one” side must have unique values in its key column.
- Many-to-one (*:1): the same relationship read from the fact table’s side.
- One-to-one (1:1): each row matches at most one row on the other side. Rare, and often a sign two tables could be merged.
- Many-to-many (*:*): neither side is unique. Power BI supports it, but a bridge table of unique keys is usually safer.
Filter direction
Cardinality works together with cross-filter direction. In a one-to-many relationship the default is single: filtering Region filters Sales, not the other way round. Setting it to both lets filters flow in either direction, but it can create ambiguity when several paths exist between two tables. Keep it to single unless you have a reason.
Where to set it in Power BI
Power BI shows cardinality and filter direction in Model view and in the relationship’s Edit dialog. It detects the cardinality when you create the relationship, so check that the detected type matches what you expect.
Best practices
- Check the key before relating. The “one” side needs unique, non-blank values.
- Prefer one-to-many from dimension to fact. It is the shape star schemas use.
- Avoid bidirectional filters by default. Turn them on for a specific visual need.
- Resolve many-to-many with a bridge table. One unique-key table in the middle keeps both sides one-to-many.
- Watch for blanks. Fact rows with no matching key show up under “(Blank)”.
Mocking up relationships
A slicer on a mockup is a promise that the filter reaches every visual on the page. Marking which visuals each filter should affect tells the model builder which relationships and directions are needed. See how to present a dashboard to stakeholders.