Star Schema
Also called: Dimensional model, Star model
A star schema is a data model with one central fact table of events and numbers, joined to dimension tables that describe them, so reports can slice measures by date, product or region.
Also called: Dimensional model, Star model
A star schema is a data model with one central fact table of events and numbers, joined to dimension tables that describe them, so reports can slice measures by date, product or region.
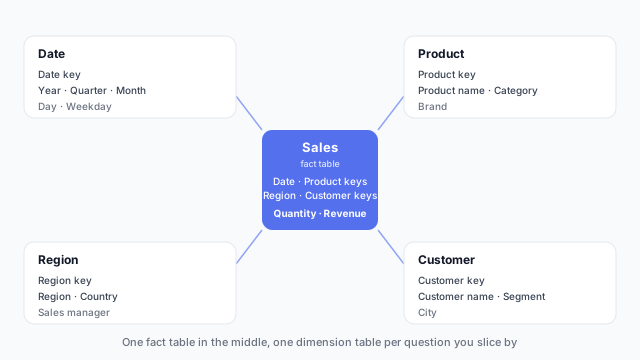
Picture one table in the middle and several smaller tables around it. The middle table, the fact table, holds one row for each thing that happened (an order line, a support ticket, a page view) with the numbers to add up, such as Quantity and Revenue. Each surrounding dimension table describes one angle on those events: Date, Product, Region, Customer.
Draw the relationships and the shape is a star. Each dimension joins to the fact table through a key, and filtering a dimension filters the facts. Pick North America in a Region slicer and only the fact rows with that region’s key stay in play, so Revenue falls from $2.80M to $1.12M.
Many reports start as a single wide export: every order line with the product category, customer segment and region typed out on each row. That works until you need to rename a category, add a second source or count customers instead of orders.
A snowflake schema normalizes the dimensions further: Product joins to Subcategory, which joins to Category. It stores each value once, but report authors then have to follow longer chains of relationships. For analytics models, flatten the chain into a single Product table unless you have a strong reason not to.
| Power BI | Tableau | |
|---|---|---|
| Where you model it | Model view in Power BI Desktop, saved in the semantic model | Relationships canvas in the data source tab |
| Typical advice | Build a star schema, hide the key columns | Relate fact and dimension tables; one wide table also works |
Every filter and chart on a mockup becomes a dimension or measure in the model, so sketch the page before the tables. A dashboard that shows revenue by region, product and month tells you the dimensions you need. See why to mock up Power BI reports before you build.
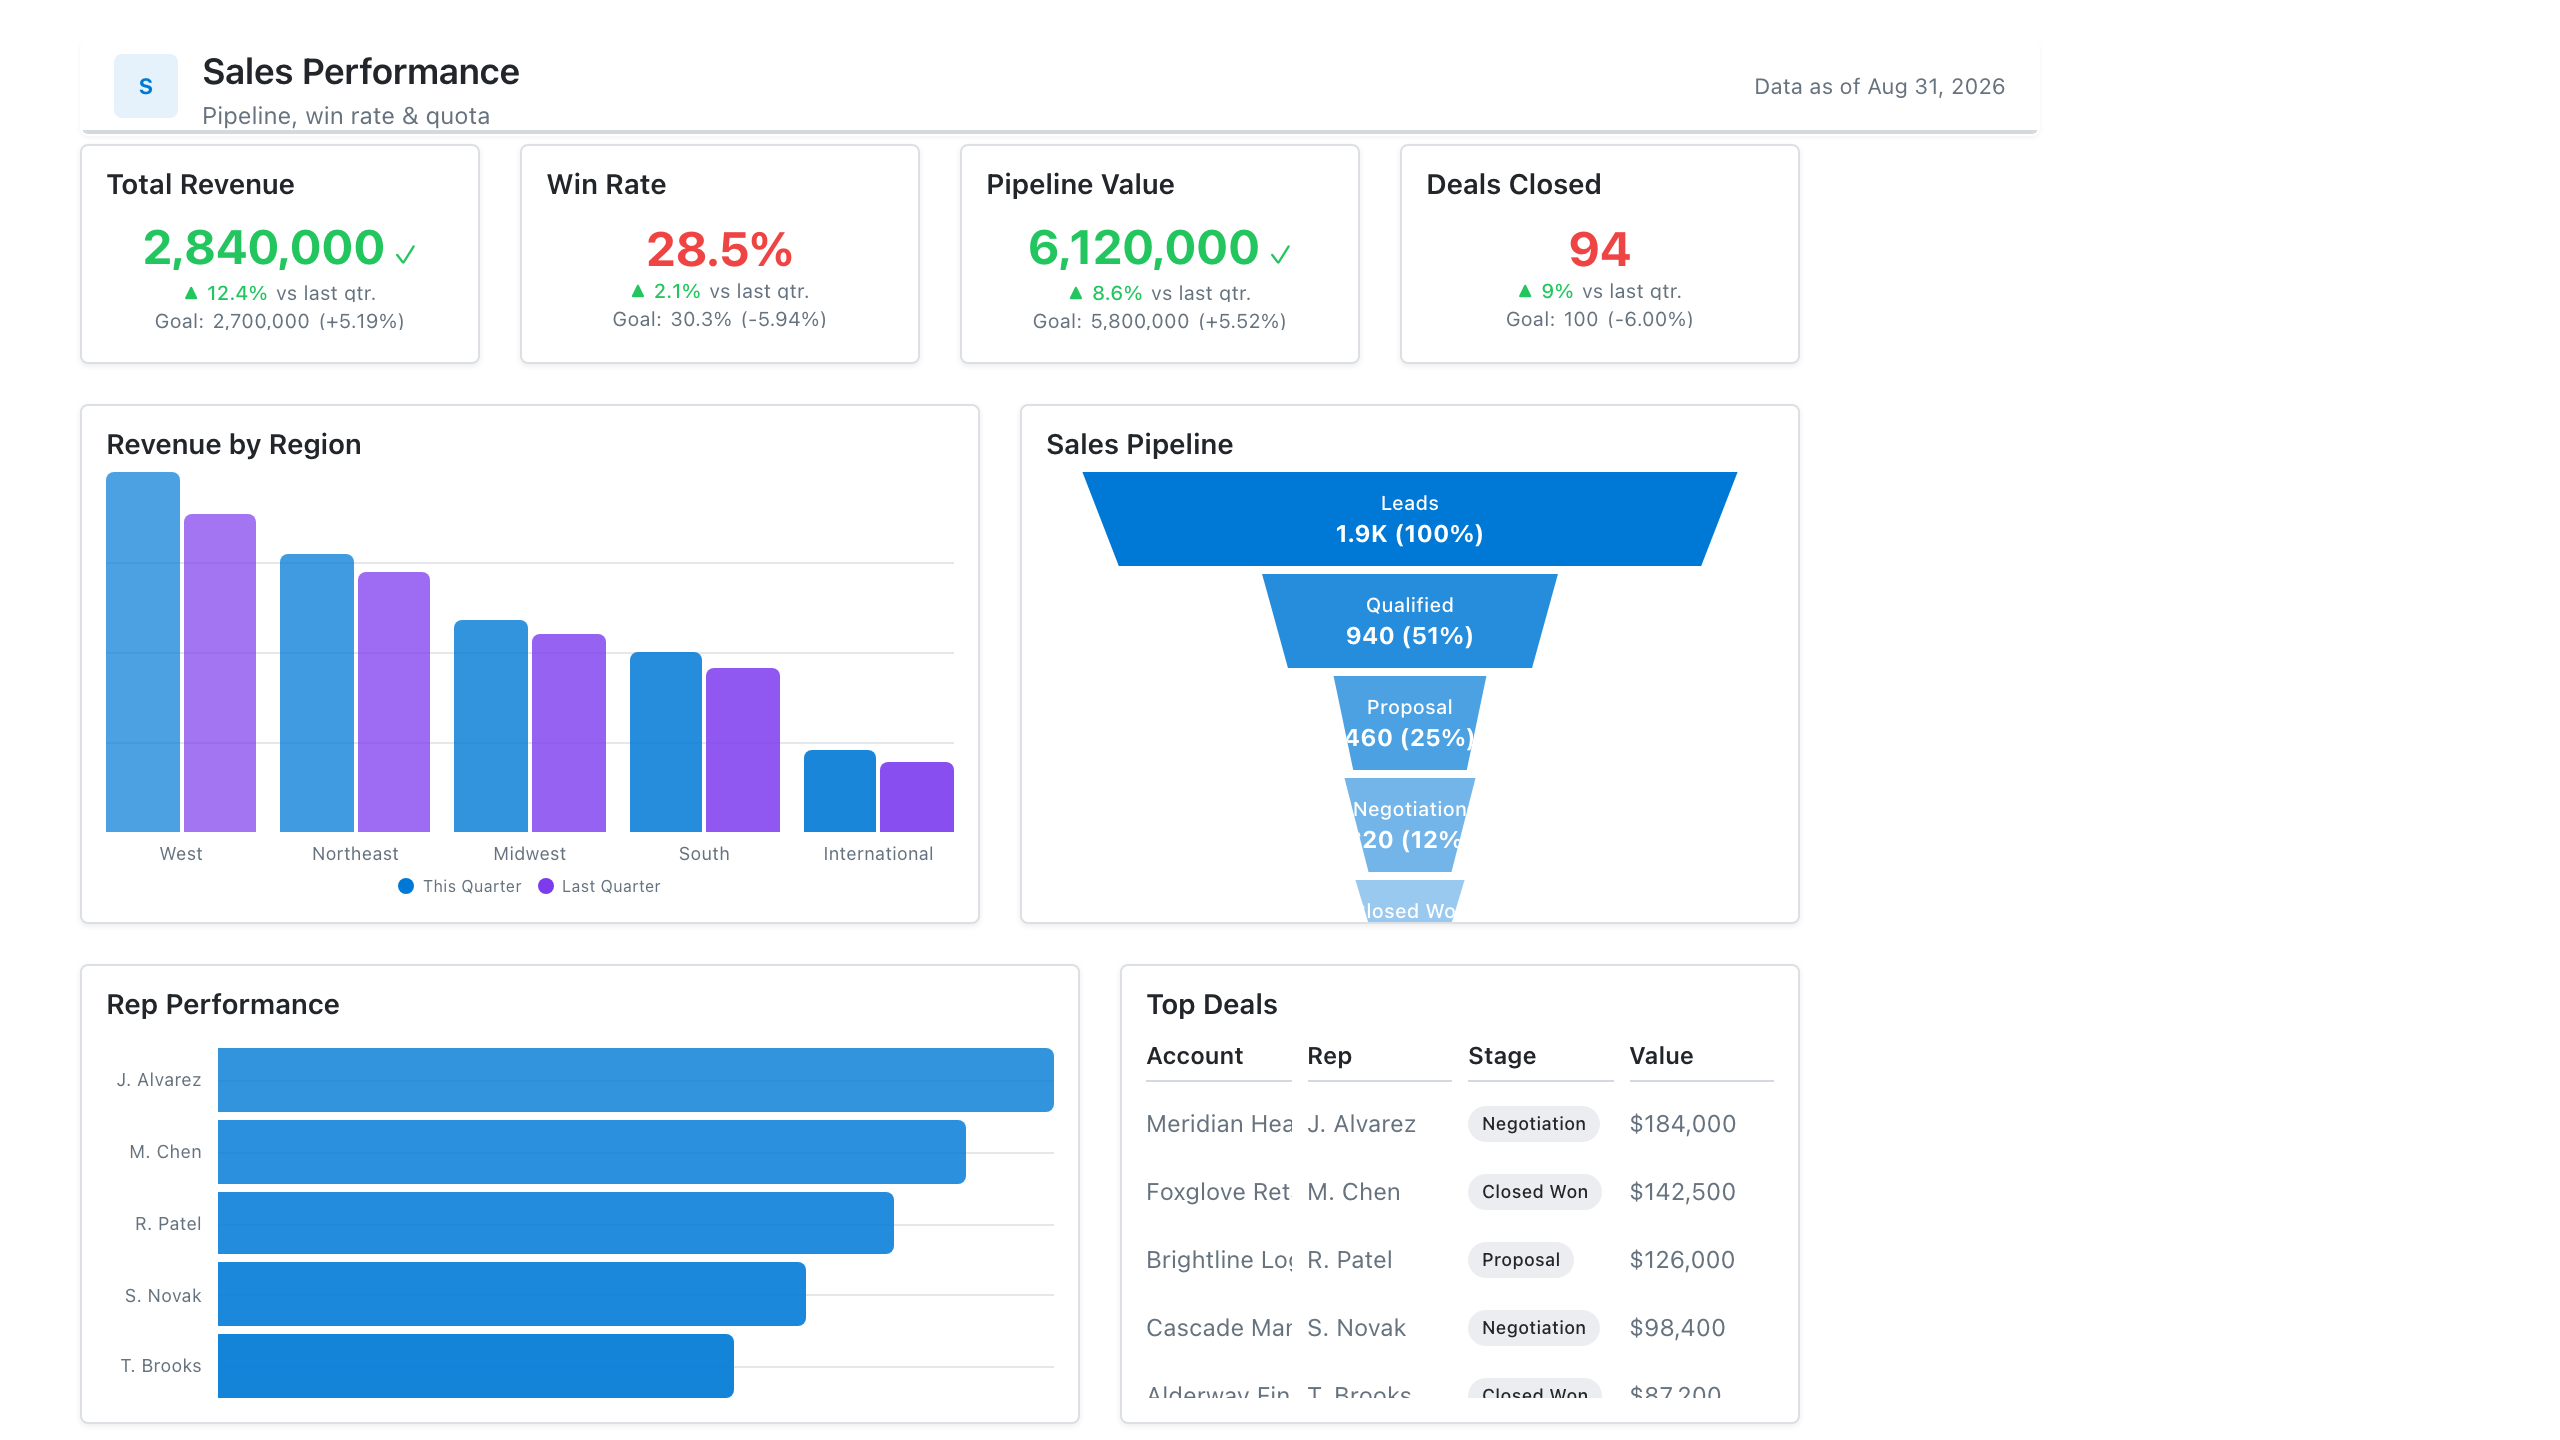
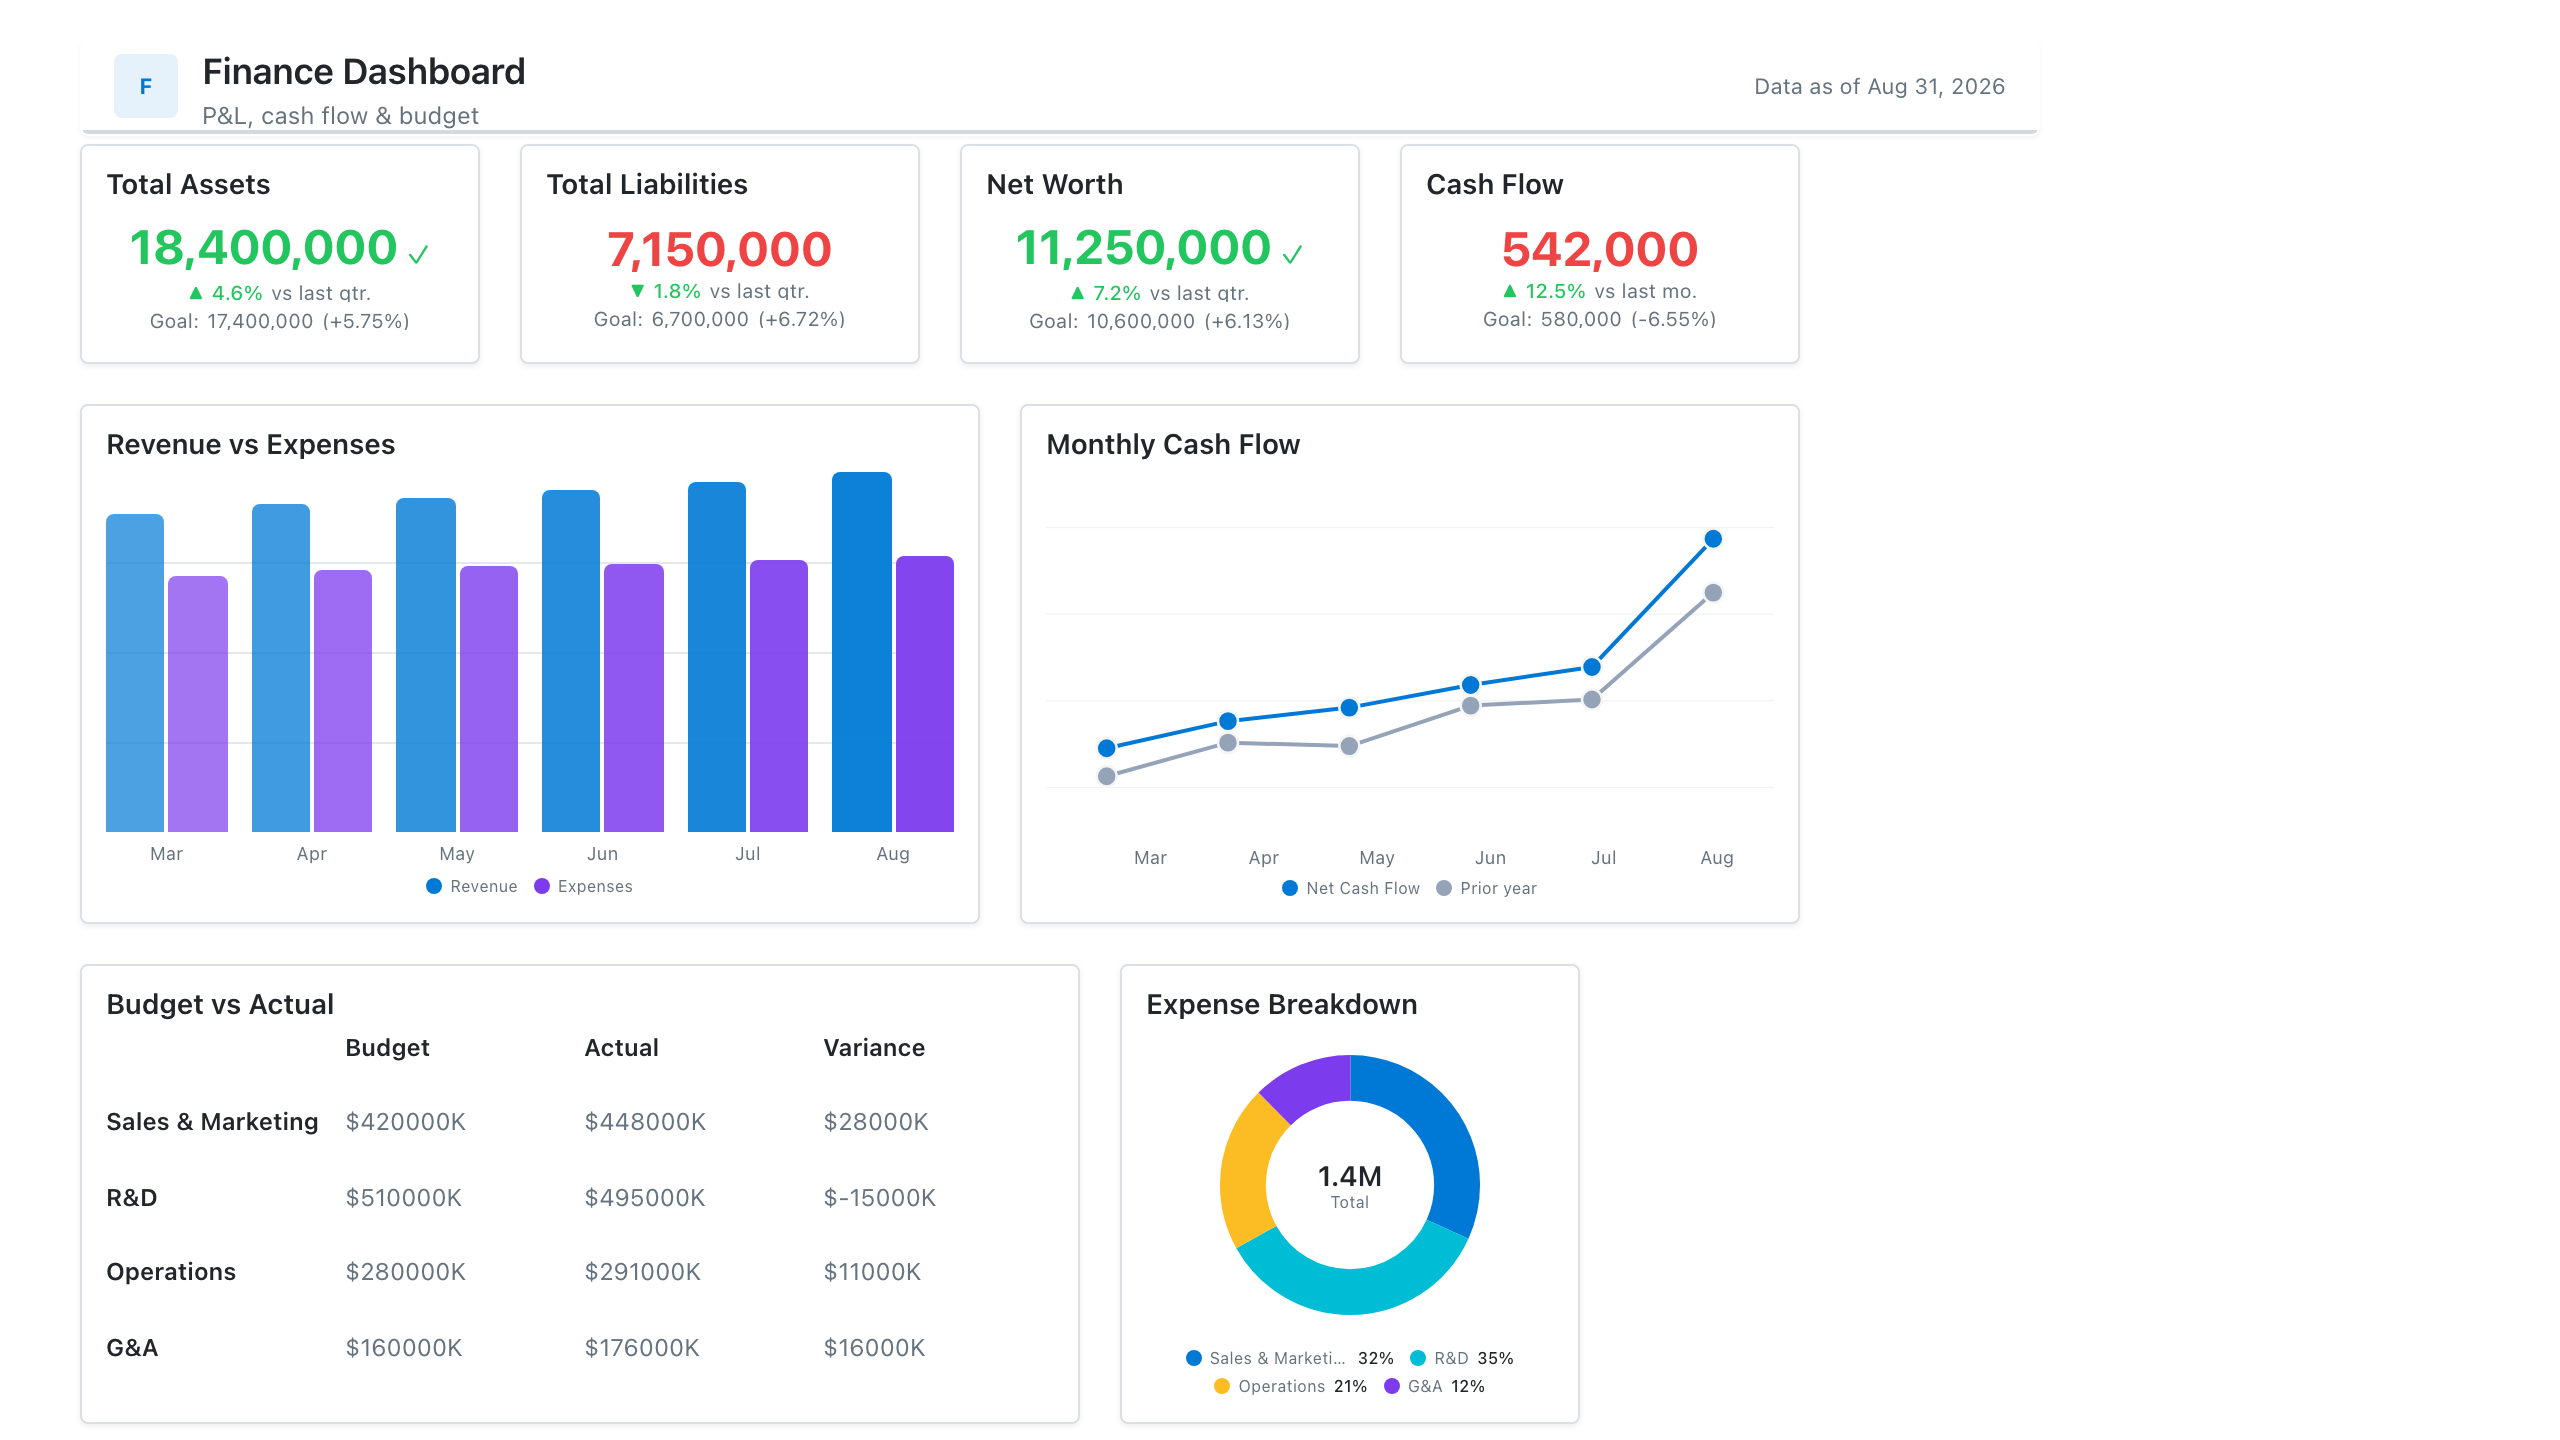
These free Mockko templates use it. Open one and edit it in your browser.
Lay out your Power BI or Tableau dashboard in Mockko, get sign-off, then build. Free to start.
Try Mockko free