Dashboard design

Data-Ink Ratio

Also called: Data-to-ink ratio, Chartjunk

The data-ink ratio is the share of a chart's ink that shows actual data. Coined by Edward Tufte, it argues for removing borders, heavy gridlines and decoration that don't carry information.
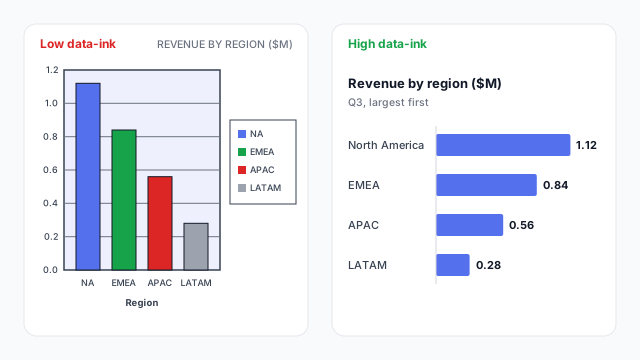
The same revenue by region data drawn twice. Left, low data-ink: a framed, shaded plot with dark gridlines, a different colour per column and a legend that repeats the axis labels. Right, high data-ink: sorted bars in one colour with values labelled directly: North America $1.12M, EMEA $0.84M, APAC $0.56M, LATAM $0.28M.

How it works

Edward Tufte introduced the idea in The Visual Display of Quantitative Information (1983):

Data-ink ratio = ink used to show data ÷ total ink used in the chart

Data ink is the bars, lines, points and value labels: the part you couldn’t erase without losing information. Everything else (frames, background fills, heavy gridlines, tick marks, redundant legends) is non-data ink. Tufte’s guidance is to maximise the share of data ink, within reason.

In the example, both charts show the same four numbers. The left one spends most of its ink on a frame, a shaded plot area, five dark gridlines, black outlines and a legend that repeats the axis labels. It also gives each region a different colour, so readers look for a meaning that isn’t there. The right one sorts the bars, uses one colour and puts the values on the bars, so the gridlines and the axis aren’t needed.
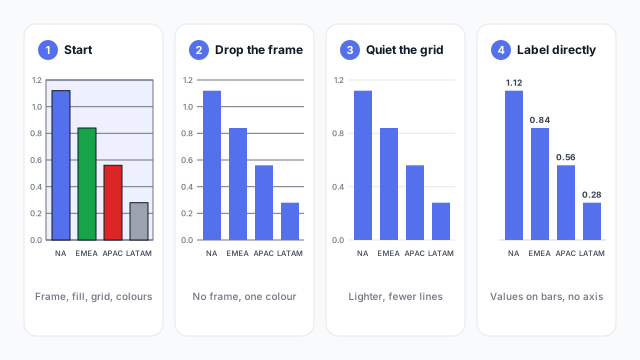
Raising the ratio, step by step

The same revenue by region column chart in four steps: 1, a framed and shaded plot with dark gridlines and a different colour per column; 2, frame and fill removed and one colour; 3, gridlines lightened and halved; 4, gridlines and axis removed with the values labelled on each column

  1. Remove the frame and fill. Plot borders and background shading carry no data.
  2. Use one colour unless colour encodes something, such as a highlighted category or good and bad.
  3. Quiet the grid. Lighter, fewer gridlines, or none at all.
  4. Label directly. When values sit on the bars, the axis and gridlines become optional, and the legend can go.

Each step is small. Together they make the data the loudest thing on the page, which is the same goal as good visual hierarchy.

Where it applies on a dashboard

Every visual, but it matters most on dense pages. Twelve charts with frames and heavy grids add up to a lot of noise. A sparkline is the idea at its most extreme: a trend with no axes, labels or grid. Set the defaults once in the report theme, such as no visual borders and light gridlines, so every new chart starts clean.

Common mistakes

  • Going too far. Removing the baseline or every label makes values hard to compare. “Within reason” is part of the rule.
  • Colour as decoration. A different colour per bar adds ink and implies a meaning that isn’t there.
  • Redundant legends. If the categories are already on the axis, or labelled directly, the legend repeats them.
  • Heavy gridlines. Dark gridlines compete with the bars. If you need them, make them light grey.
  • Decorative backgrounds. Images, gradients and patterns behind charts lower contrast and add nothing.

Mocking up with less ink

It’s faster to strip decoration from a mockup than from twenty finished visuals, so set the clean style at the mockup stage. Our dashboard wireframe best practices cover keeping each page focused on its main question.

See it in a real layout

These free Mockko templates use it. Open one and edit it in your browser.

Related terms

Common questions

What is a good data-ink ratio?
There's no target number. Tufte's advice is to maximise it "within reason": remove ink until removing more would make the chart harder to read. In practice that means light or no gridlines, no borders or background fills, and direct labels where they fit.
What is chartjunk?
Tufte's word for decoration that doesn't carry information: heavy grids, 3D effects, pictures, patterns and ornamental borders. It's the main thing a high data-ink ratio removes.
Can you take the data-ink ratio too far?
Yes. Stripping out every axis, label and gridline can leave a chart that's hard to read or compare. Keep anything that helps the reader get the number right, such as a baseline, a target line or a few light gridlines on a long axis.

Mock it up before you build it

Lay out your Power BI or Tableau dashboard in Mockko, get sign-off, then build. Free to start.

Try Mockko free