Dashboard design

Report Theme

Also called: Power BI theme, JSON theme, Theme file, Workbook formatting (Tableau)

A report theme is a saved set of colours, fonts and visual defaults that a BI tool applies to every visual in a report at once. In Power BI it's a JSON theme file.

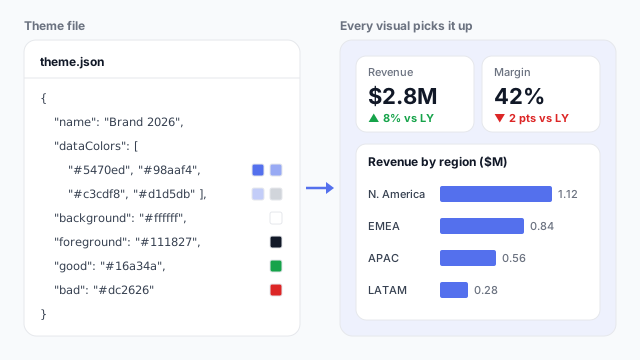
A theme.json file listing a name, four data colours from brand blue to grey, a white background, a dark foreground, and green and red for good and bad, applied to a dashboard: revenue $2.8M up 8% in green, margin 42% down 2 points in red, and revenue by region in brand blue.

How it looks in each tool

Same idea, different name. Here's the report theme (or its equivalent) in each BI tool.

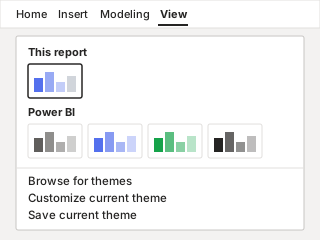
Power BI Themes menu on the View ribbon, showing the current report's theme, a gallery of built-in themes, and the Browse for themes, Customize current theme and Save current theme options.
Power BI Report theme (JSON) A real file: import, customise and export it as JSON.
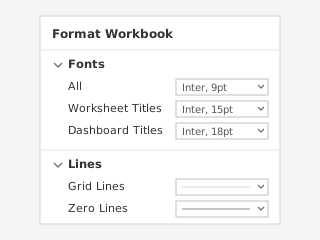
Tableau Format Workbook pane with font settings for All, Worksheet Titles and Dashboard Titles, and line settings for Grid Lines and Zero Lines.
Tableau Format Workbook + custom palettes Fonts and lines per workbook. Colour palettes live in Preferences.tps.
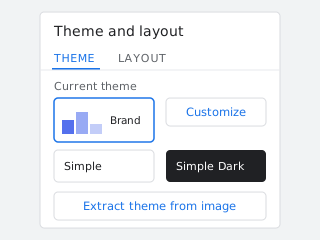
Looker Studio Theme and layout panel with the current theme, the Simple and Simple Dark themes, a Customize button and an Extract theme from image button.
Looker Studio Theme and layout Pick a built-in theme, customise it, or extract one from an image.

Illustrations, not screenshots. Product names are trademarks of their owners.

How it works

Without a theme, every chart gets the tool’s default colours and someone formats each visual by hand. A theme moves those choices into one place.

The example theme sets:

  • Data colours, in order. The first series in every chart uses brand blue #5470ed, the second uses the lighter #98aaf4, and so on. A one-measure bar chart like “Revenue by region” uses the first colour only.
  • Background and foreground: white visuals with near-black #111827 text.
  • Good and bad: green for revenue up 8% against last year, red for margin down 2 points.

Change one value in the file and every visual on every page updates. That’s the point: consistency by construction, not by checking each chart.

What a theme controls
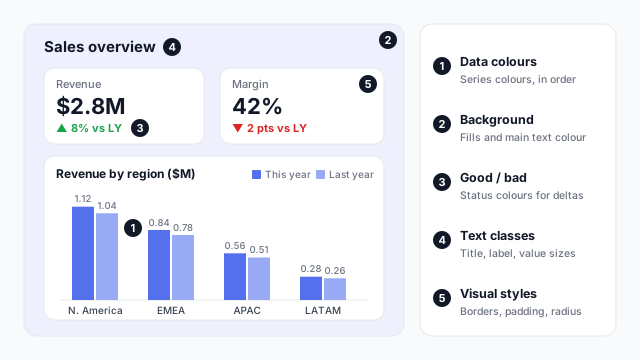
A sales dashboard annotated with five things a theme controls: 1, data colours used by This year and Last year columns; 2, the background of the page and visuals; 3, the good and bad colours on the deltas; 4, text classes for the title and labels; 5, visual styles such as borders and corner radius on the KPI tiles

  1. Data colours. The ordered series palette. This year is always the first colour, last year the second.
  2. Background and foreground. Fill colours and the main text colour.
  3. Status colours. Good, neutral and bad, used by conditional formatting and KPI visuals.
  4. Text classes. Font family, size and colour for titles, labels and callout values.
  5. Visual styles. Defaults per visual type, such as borders, padding, corner radius and whether titles show.

In Power BI vs. Tableau vs. Looker Studio

ToolWhereSaved and reused as
Power BIView ribbon > ThemesA .json file you import into any report
TableauFormat > WorkbookPer-workbook settings; colour palettes in Preferences.tps on each machine
Looker StudioTheme and layout panelA report setting; can extract colours from an image

Best practices

  • Start from the brand, then cut. Four to six data colours is plenty. More colours make charts harder to read, not more on-brand.
  • Order colours by importance. The first data colour is used most, so make it the one you want readers to notice.
  • Keep status colours for status. If brand green is also the “good” colour, readers will read every green bar as good news.
  • Version the file. Keep the theme JSON in a shared folder or repo, next to the report style guide it implements.
  • Test with real visuals. A palette that looks good as swatches can fail on a stacked chart. Check contrast and colour-blind safety on a full page.

Mocking up the theme

Agree colours and fonts on a mockup before anyone writes JSON: it’s easier for stakeholders to react to a themed page than to a list of hex codes. See why to mock up Power BI reports before you build.
Related terms

Common questions

How do I import a theme in Power BI?
In Power BI Desktop, open the View ribbon, expand the Themes gallery and choose Browse for themes, then pick your .json file. The theme applies to every page in the report straight away.
What goes in a Power BI theme JSON file?
Only `name` is required. Most themes also set `dataColors` (the series colours, in order), `background`, `foreground`, `tableAccent`, the status colours `good`, `neutral` and `bad`, and optionally `textClasses` for font sizes and `visualStyles` for per-visual defaults.
Does Tableau have themes like Power BI?
Not as a single file. Format > Workbook sets fonts and lines for the whole workbook, and custom colour palettes are added to the Preferences.tps file in your My Tableau Repository folder.

Mock it up before you build it

Lay out your Power BI or Tableau dashboard in Mockko, get sign-off, then build. Free to start.

Try Mockko free