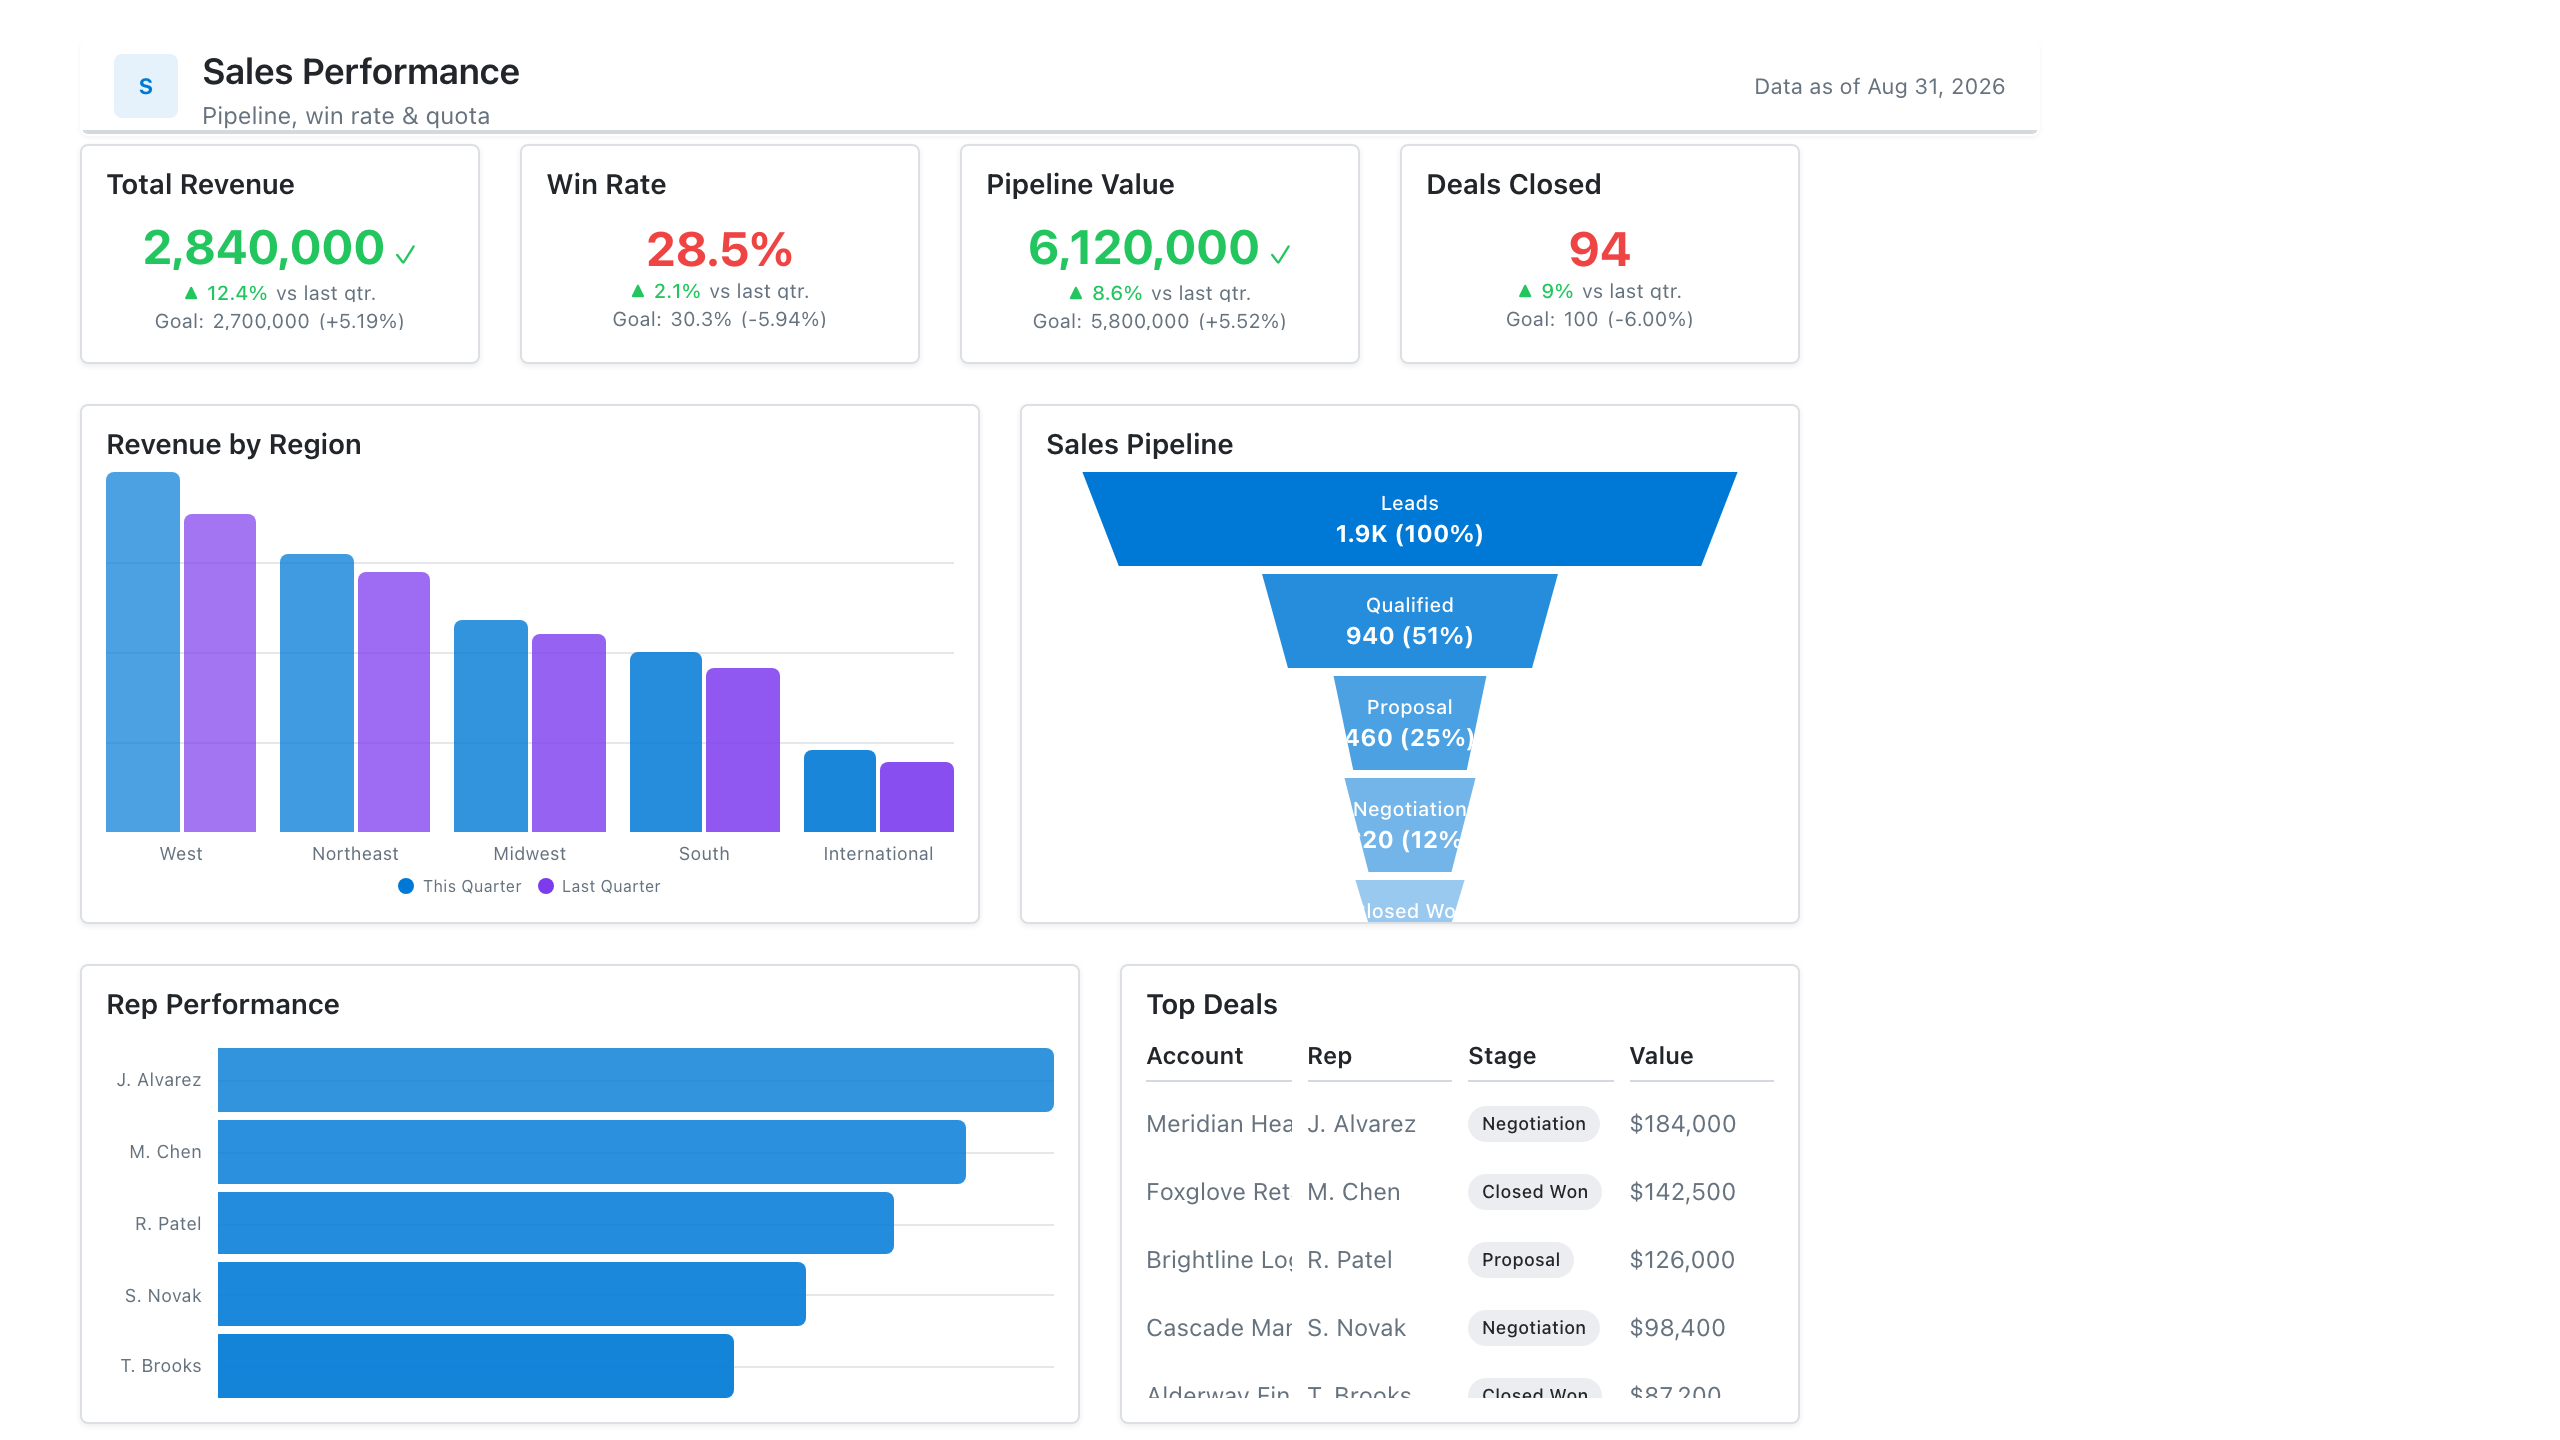
How it works
Every report page has a width and height in pixels. Visuals are positioned and sized within that space, and the BI tool scales the whole page to fit the viewer’s screen.
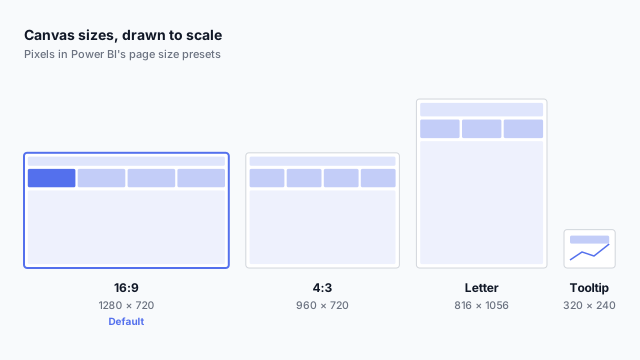
Power BI’s page size presets, drawn to scale above:
- 16:9, 1280 × 720. The default. Matches most laptop and monitor screens, and slides.
- 4:3, 960 × 720. Squarer, for older displays or embedding in a narrower space.
- Letter, 816 × 1056. Portrait, for reports that will be printed or exported to PDF.
- Tooltip, 320 × 240. For tooltip pages that pop up over a visual.
- Custom. Any size, such as a long page for scrolling.
Pick the size before placing anything. Changing it later means repositioning every visual on the page.
Plan the grid in canvas pixels
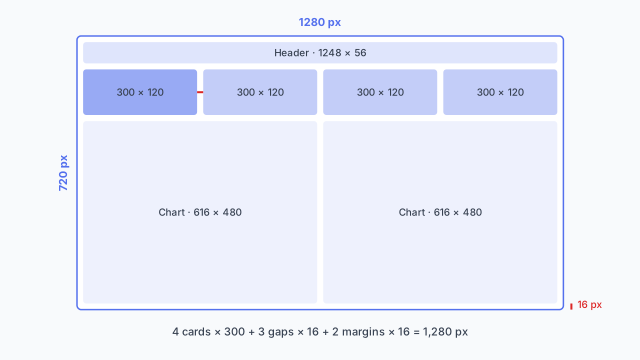
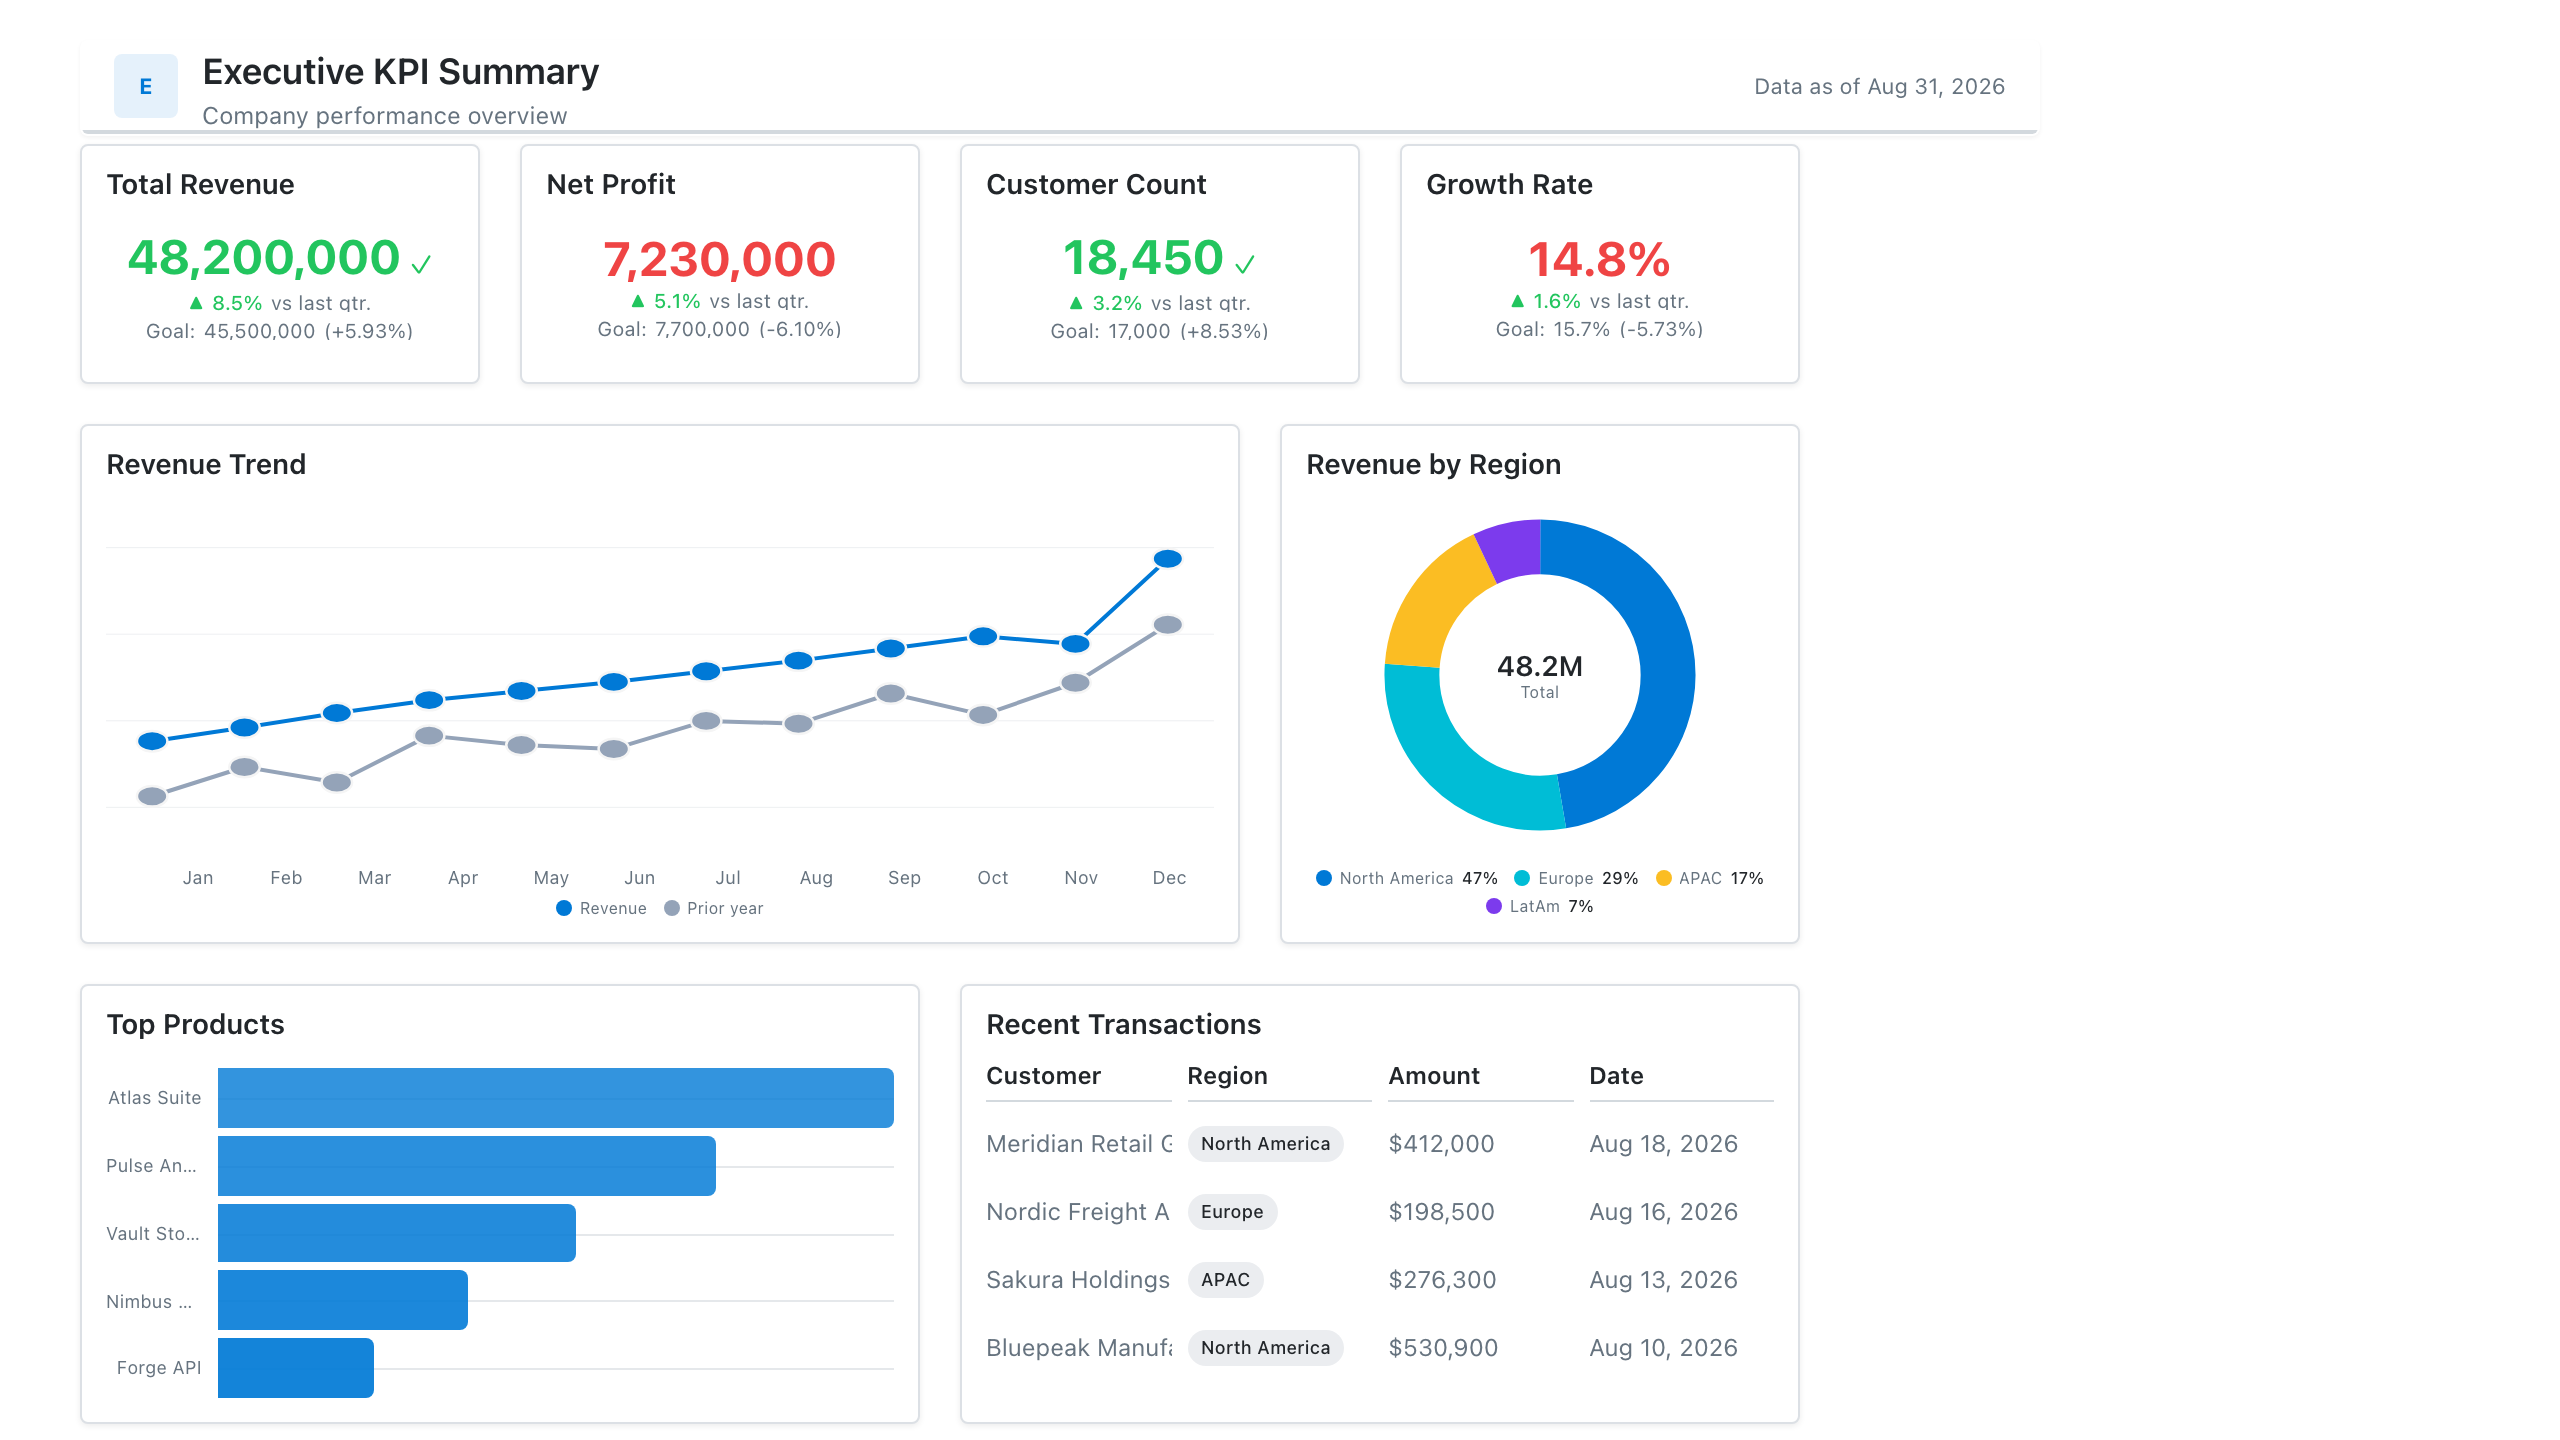
Knowing the exact canvas size lets you plan a grid that adds up. On a 1280 × 720 page with 16 px margins and gaps, four KPI cards are 300 px wide each (4 × 300 + 3 × 16 + 2 × 16 = 1,280), and two charts below are 616 px wide. Vertically, 16 + 56 + 16 + 120 + 16 + 480 + 16 = 720. Put those numbers in your report style guide so every report uses the same grid.
In Power BI vs. Tableau
| Power BI | Tableau |
|---|
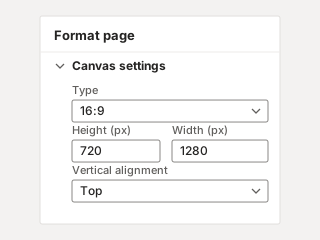
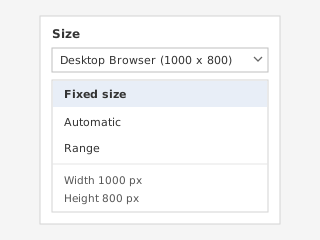
| Where | Format page > Canvas settings | Dashboard pane > Size |
| Default | 16:9, 1280 × 720 | Fixed size, Desktop Browser (1000 × 800) |
| Options | 16:9, 4:3, Letter, Tooltip, Custom | Fixed size, Automatic, Range |
| Mobile | Separate mobile layout view | Device layouts (Device Designer) |
Best practices
- Standardise one size. Pick a canvas size for the team and use it on every report, so layouts and templates are reusable.
- Design for the real screen. If most viewers open reports on a laptop, check the page at laptop size, not only on a large monitor.
- Use Letter for print. If a report will be exported to PDF or printed, design it in portrait from the start.
- Don’t scroll by accident. A custom tall page is fine on purpose, but readers often miss what’s below the first screen. Put the headline in the top left, as in a Z or F layout.
Mocking up at the right size
Set the canvas size on the mockup so the layout you agree is the layout you build. Mockko’s canvas presets include Power BI’s 16:9, Letter and Tooltip sizes. See why to mock up Power BI reports before you build.