Executive Dashboard Mockup Template
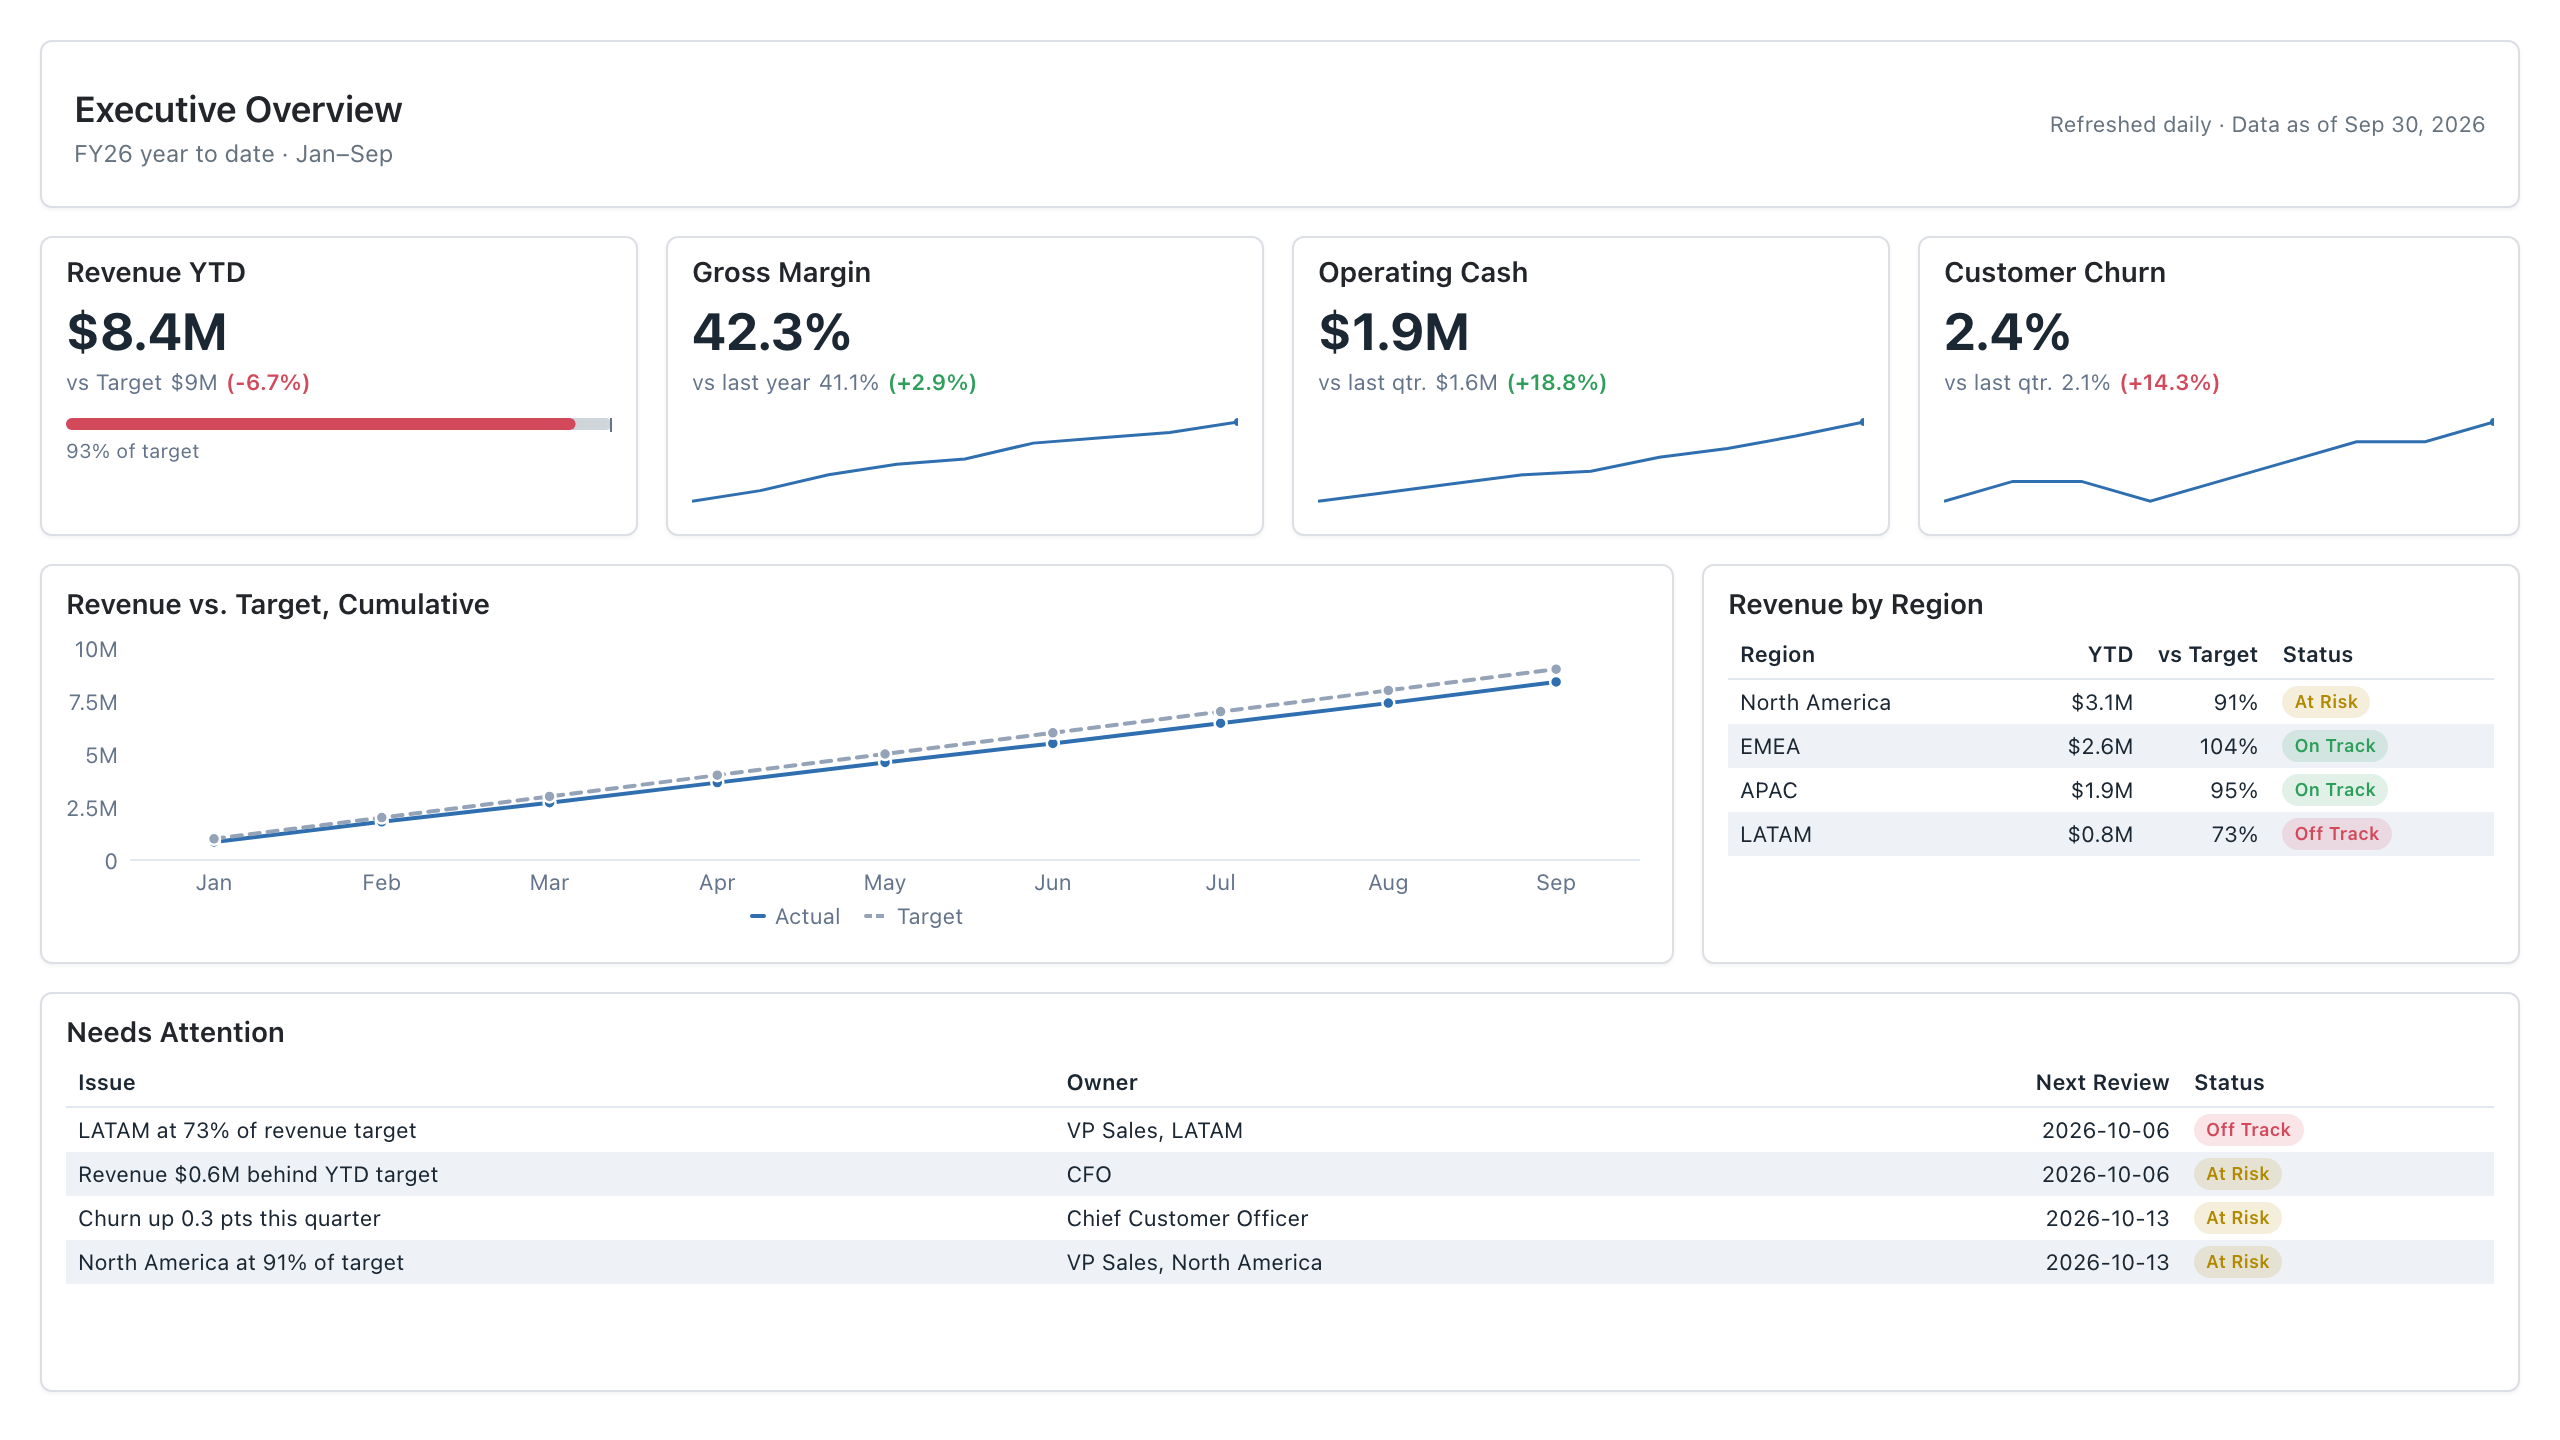
The Executive dashboard template is a one-page layout that lets executives and finance leaders see which targets are slipping and who owns each fix, so they can decide where to intervene before the next review. It shows revenue, gross margin, operating cash and churn against targets, a cumulative revenue trend and regional status.
Click the mockup to open it full size
About this template
ExecutiveBuilt the way an executive dashboard should be: a handful of metrics, each shown against a target or prior period, so a leader can see in seconds what needs attention. Revenue is tracked cumulatively against plan, regions carry an on-track / at-risk / off-track status, and a short Needs Attention list names an owner for every exception.
Metrics this dashboard tracks
- Revenue YTD vs. target
- Gross margin vs. last year
- Operating cash
- Customer churn
- Cumulative revenue vs. target
- Revenue status by region
- Exceptions with owners
What's on the Executive dashboard?
| Section | What it shows | Why it's here |
|---|---|---|
| Header band Title, period subtitle, refresh note | The dashboard name (Executive Overview), the reporting period (FY26 year to date, Jan to Sep) and how fresh the data is (refreshed daily, data as of a stated date). | It tells the reader which period and data cut they are judging before they look at any number. A stale or mislabeled period is the quickest way to lose trust in the rest of the page. |
| KPI row Four KPI cards, each with a comparison and a sparkline; the first also has a progress bar | Revenue YTD against target with a percent-of-target bar, Gross Margin against last year, Operating Cash against last quarter, and Customer Churn against last quarter. Variance is colored green or red. | These four numbers are the headline answer to whether the business is on plan. A reader who stops here still leaves knowing which measures moved the wrong way, and the colors show it without reading the comparison text. |
| Trend and regions row Two-line chart (wide, left) and a status table (narrow, right) | Left: cumulative revenue, actual versus target, by month. Right: Revenue by Region with YTD revenue, percent of target and an On Track, At Risk or Off Track badge per region. | The line shows whether the revenue gap is widening or closing, and the table shows which region is causing it. Together they tell the reader whether to wait or to start asking one region for answers. |
| Needs Attention list Full-width table with status badges | One row per exception with the issue, a named owner, the next review date and a status badge. It turns the numbers above into actions. | The list changes the report from a status update into a set of commitments. Each reader can see who is expected to respond and when, so follow-up does not depend on someone remembering to ask. |
What each metric means
Revenue YTD vs. target
- Definition: Revenue recognised from the start of the fiscal year to the data date, compared with the plan for the same period.
- Formula:
Percent of target = revenue YTD / target YTD - Why it matters: It is the first answer a leader wants: are we ahead of or behind plan. The progress bar shows the gap at a glance.
- Why a KPI card with progress bar: A KPI card puts the figure and its variance in one place, and the bar beside it shows how close the total is to target. A table of numbers would need the reader to do that comparison themselves.
Gross margin vs. last year
- Definition: The share of revenue left after the direct cost of delivering the product or service, compared with the same period a year earlier.
- Formula:
Gross margin = (revenue - COGS) / revenue - Why it matters: It shows whether growth is profitable. Revenue can rise while margin falls if costs or discounting grow faster.
- Why a KPI card: A single large percentage with a comparison and a small trend line is easy to read at a glance. A full chart would give a metric that moves a few points more space than it needs.
Operating cash
- Definition: Cash generated by day-to-day operations in the period, compared with the previous quarter.
- Why it matters: Profit and cash can diverge because of payment timing and working capital. This card shows whether the business is funding itself.
- Why a KPI card: Cash is one figure with one comparison, which is what a card is built for. The sparkline adds direction over recent periods without needing axes.
Customer churn
- Definition: The share of customers lost during a period, compared with the previous quarter. Lower is better, so a rise is shown in red.
- Formula:
Churn rate = customers lost in period / customers at start of period - Why it matters: Churn erodes recurring revenue and raises the cost of hitting the revenue target, so it is an early warning for later revenue misses.
- Why a KPI card: The card shows the current rate next to the prior quarter, and a red variance flags that a lower-is-better measure moved the wrong way. A line chart alone would not say which direction is bad.
Cumulative revenue vs. target
- Definition: Running total of monthly revenue plotted against the running total of the monthly plan, so the gap builds up visibly over the year.
- Formula:
Cumulative revenue in month n = sum of revenue for months 1 to n - Why it matters: A single YTD number hides when the gap opened. The two lines show whether the shortfall is widening, steady or closing.
- Why a line chart: Lines over time make the distance between actual and target visible as a gap. A column chart would hide that the totals only ever accumulate.
Revenue by region status
- Definition: YTD revenue per region, its percent of regional target, and a status badge: On Track, At Risk or Off Track.
- Formula:
Percent of target = regional revenue YTD / regional target YTD - Why it matters: It locates the shortfall. In the mockup, one region is well below target while others are close, which points the conversation at the right owner.
- Why a table: A table keeps exact values, the percent of target and a status badge side by side for each region. A chart would show relative size but lose the precise numbers leaders will quote.
On Track, At Risk, Off Track status
- Definition: A three-level label that summarises how far a measure is from its target.
- Why it matters: A single shared label lets leaders scan without reading every number. Thresholds are set by each company, for example by percent of target, and there is no universal rule. Define them once and apply them to every region and metric.
Needs Attention exceptions
- Definition: A short list of issues that are off plan, each with a named owner, a next review date and a status.
- Why it matters: A dashboard that only reports numbers does not change anything. Naming an owner and a date makes each exception something a person must answer for.
- Why a table: Each exception has the same four attributes, so rows and columns let the reader scan down by owner, date or status. Free text in a chart would not sort or compare as easily.
Data you need to build this
- ERP or general ledger posting date, fiscal year and period, account or revenue category, net revenue amount, cost of goods sold amount, region or business unit
- Budget or planning system fiscal period, region, revenue target, gross margin target (if used)
- CRM or billing system customer ID, customer start date, cancellation or churn date, region, status (active or lost)
- Bank or treasury system, or cash flow statement period, net cash from operating activities, cash balance
- Issue or action tracker (can be a manual sheet) issue description, owner, next review date, status
Why it's laid out this way
- Only four KPI cards sit on the top row, each with one comparison and one sparkline, so the whole page can be read in seconds without scrolling.
- The single trend chart plots actual against target cumulatively. One chart with two lines answers whether the gap is growing, and no other chart competes with it.
- The Needs Attention list sits at the bottom with an owner and a review date per row, so the page ends on who must act rather than on more numbers.
Last updated:
More like this
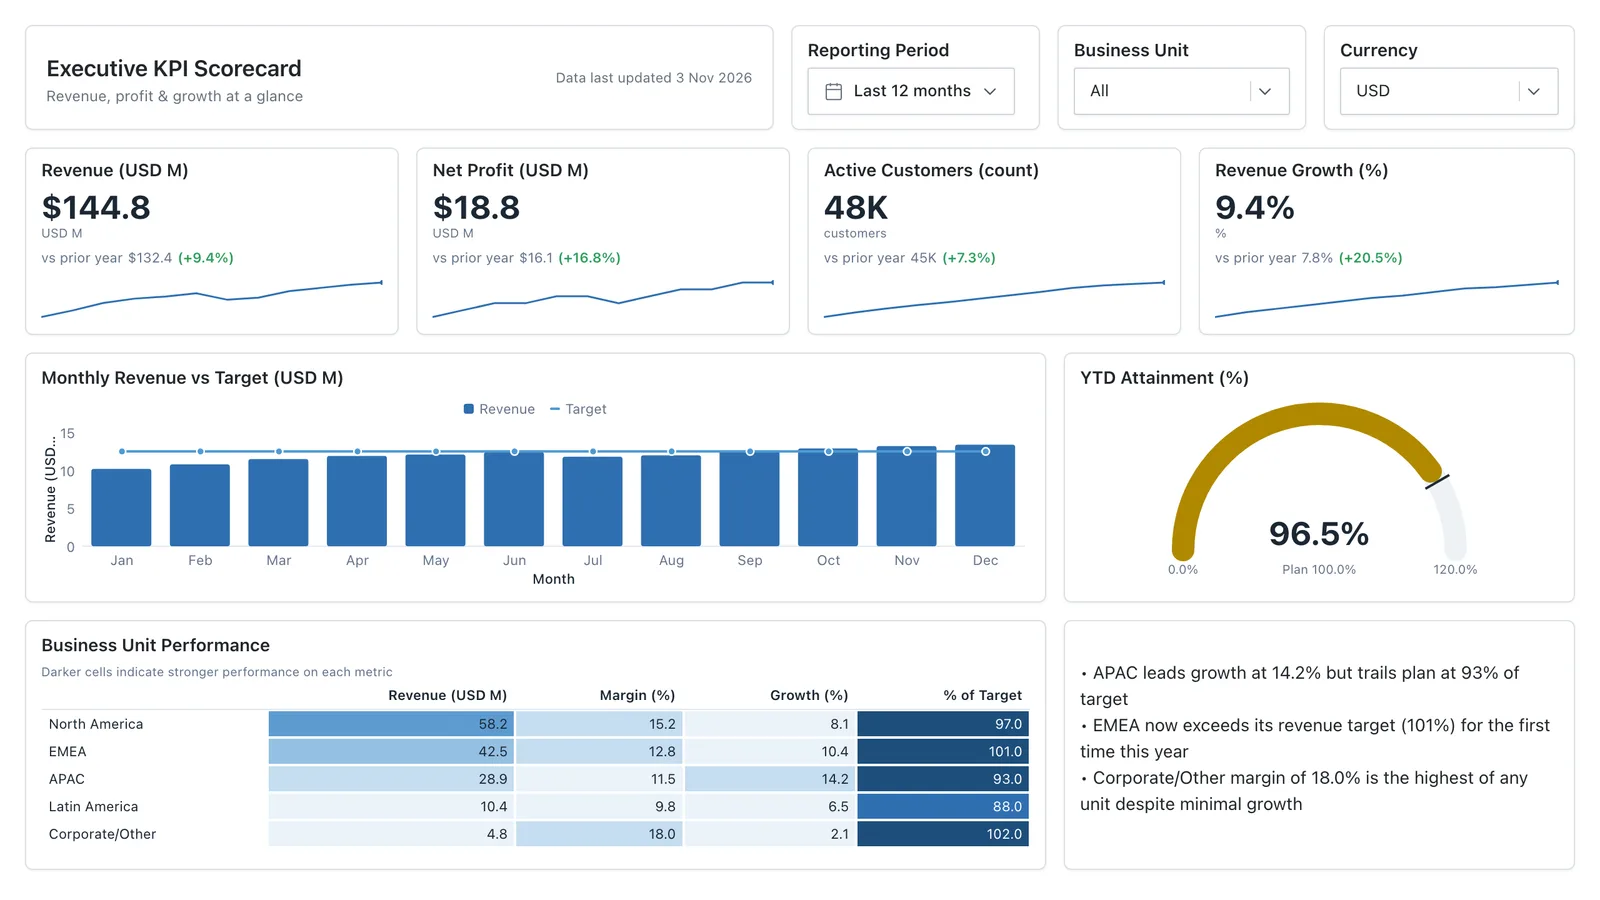
Executive KPI Overview
Single-page executive view of the metrics leadership cares about — built for the first client meeting.
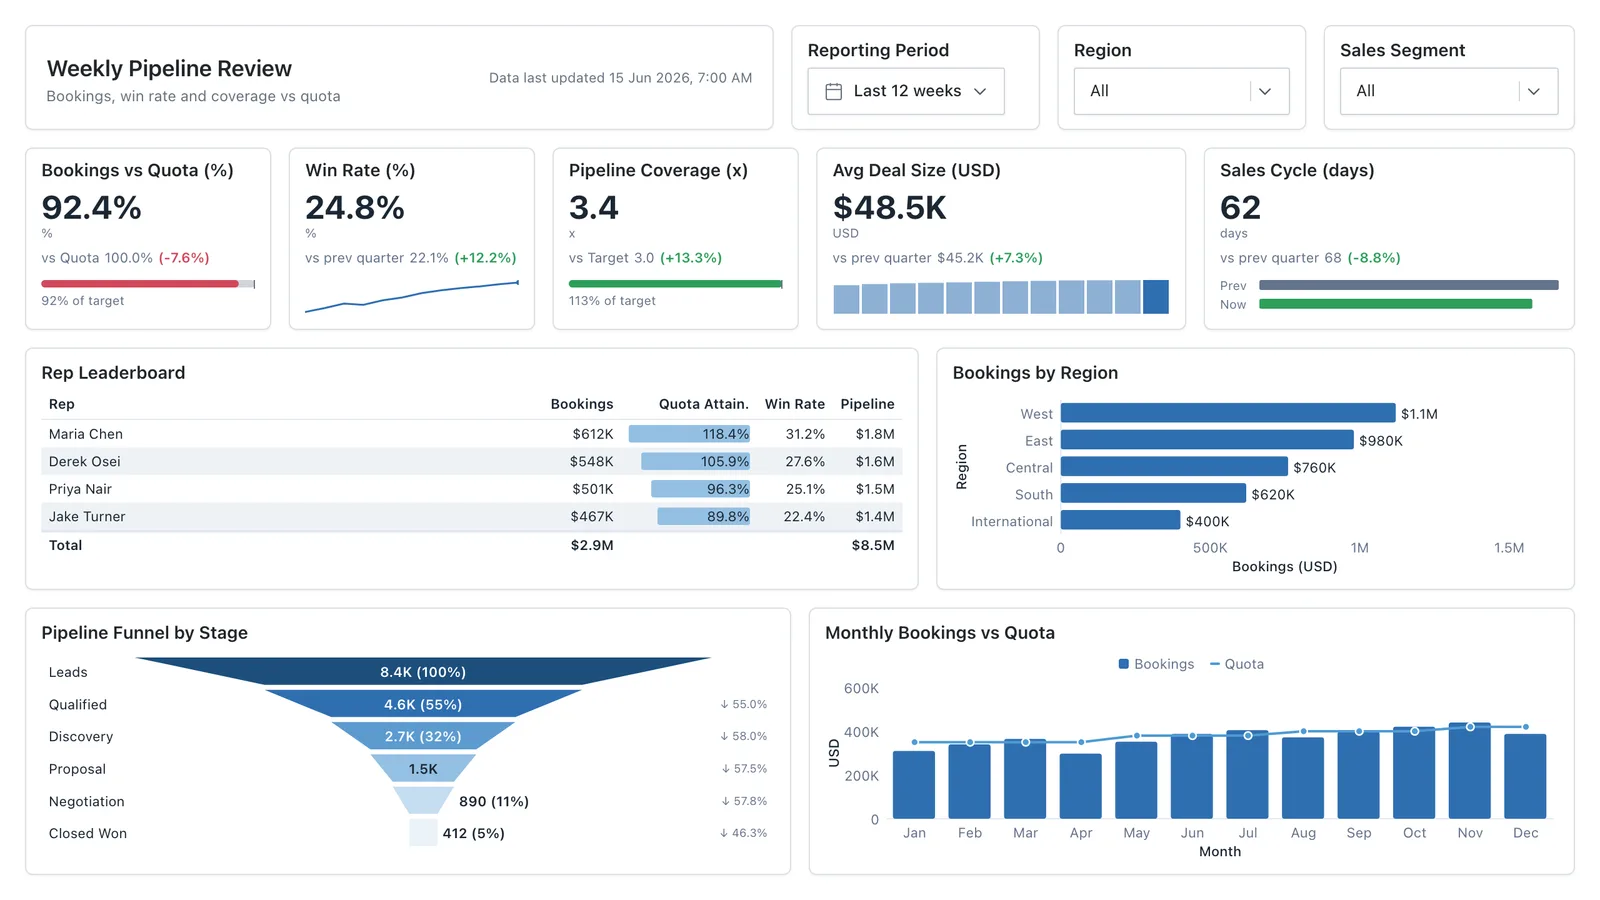
Sales Performance
Revenue, win rate, pipeline value, and rep performance across regions — the layout most sales teams build first.
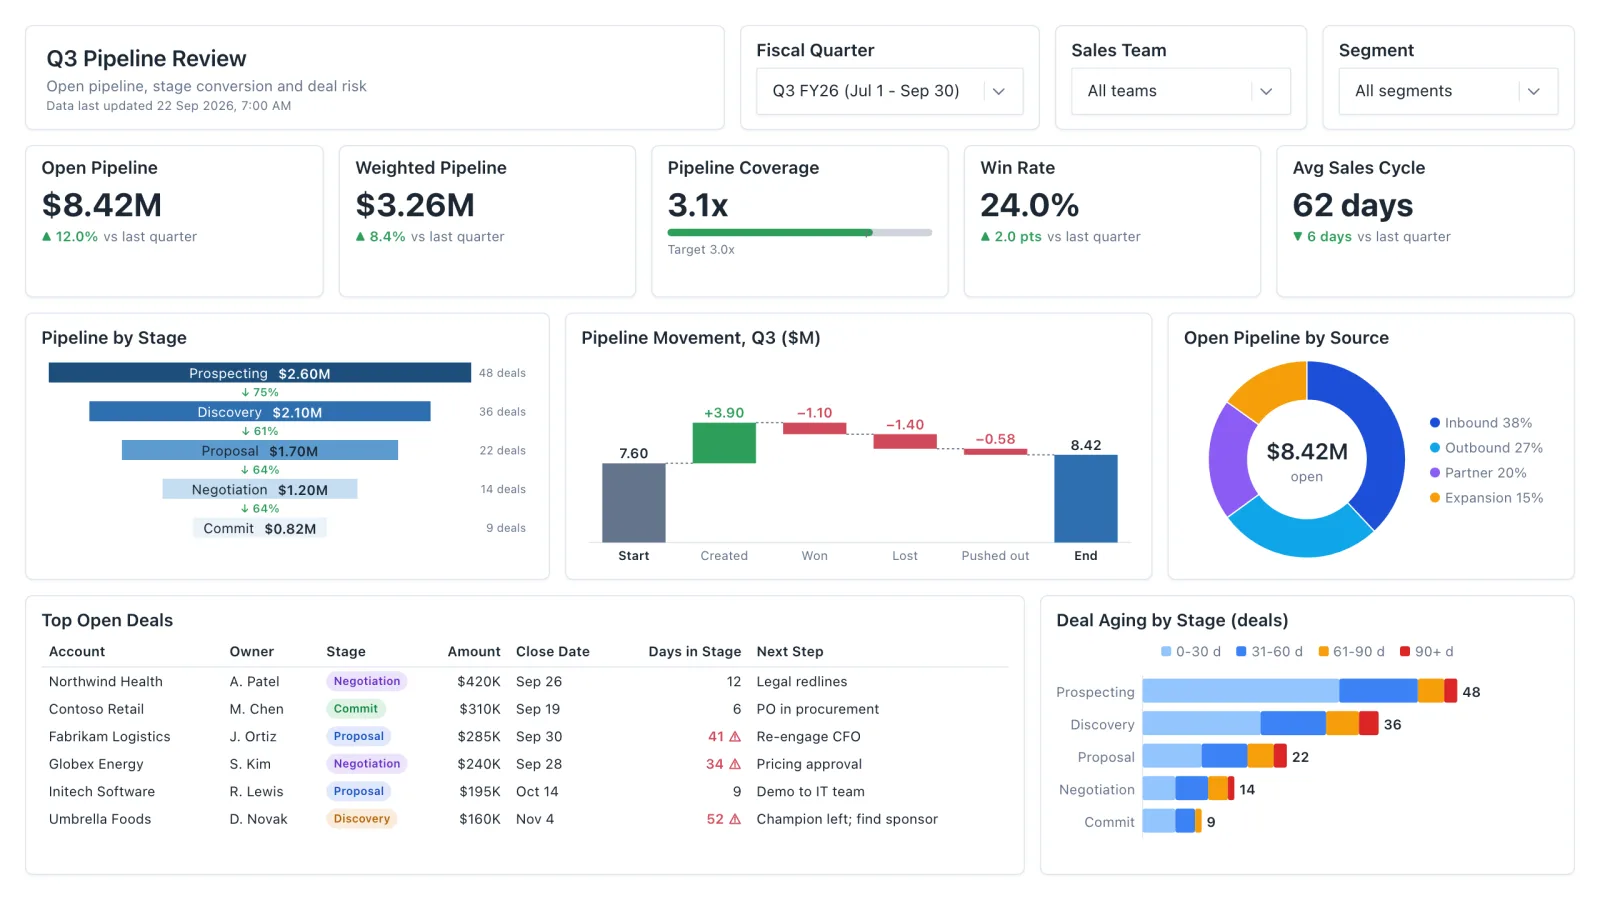
Sales Pipeline
Sales pipeline dashboard with open and weighted pipeline, coverage vs target, a stage funnel and stale-deal flags.
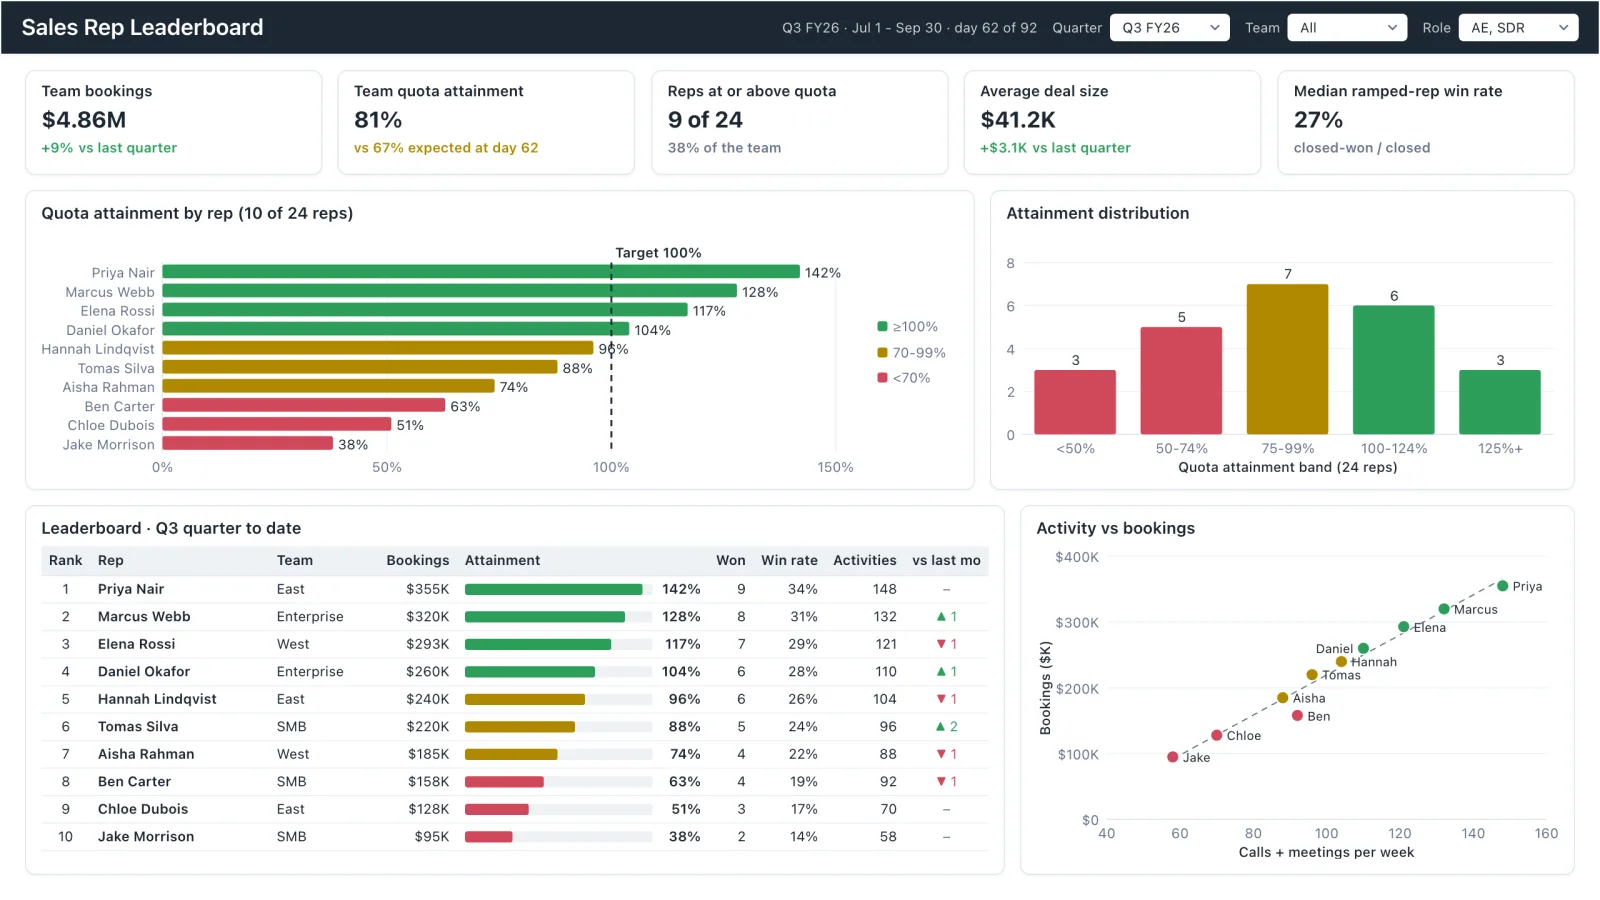
Sales Rep Leaderboard
Sales rep dashboard example with quota attainment by rep, a ranked leaderboard table and activity vs bookings.
Sales, finance, HR, SaaS, and more — filter by team or search by metric.