What it covers
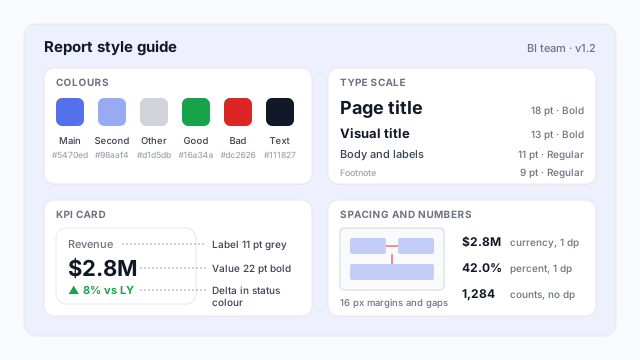
A style guide answers the questions every report developer would otherwise answer differently. The example page covers four:
- Colours. A primary and secondary series colour, grey for “Other”, and green and red reserved for good and bad. Nothing else.
- Type scale. 18 pt page titles, 13 pt visual titles, 11 pt body and labels, 9 pt footnotes. Four sizes, so there’s a clear visual hierarchy.
- Standard components. One KPI card design, used everywhere: grey label, large value, a coloured delta against last year.
- Spacing and numbers. 16 px margins and gaps on the canvas, currency to one decimal ($2.8M), percentages to one decimal (42.0%), counts with thousands separators (1,284).
A full guide usually adds page layout (where the header and filters go), which chart to use for which question, naming rules for pages and measures, and accessibility checks.
Style guide vs. theme
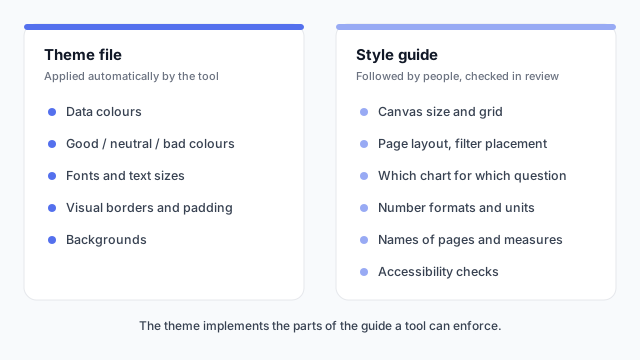
The report theme is the part of the style guide a tool can enforce. Put every rule you can into the theme file, so it’s applied without anyone remembering it. Write the rest down, with an example of each.
Where it lives
Keep the guide where report developers already work: a page in the team wiki, plus a reference report or template file that shows every standard component on one canvas. A visual example gets followed far more than a paragraph of rules.
Best practices
- Show, don’t describe. A reference page with the real KPI card, header and table beats a written spec of each.
- Keep it short. A guide nobody reads isn’t a standard. Cover the decisions people actually get wrong.
- Pair it with the theme file. Version them together, so the guide and the theme never disagree.
- Review against it before publishing. A two-minute checklist at the end of a build catches most drift.
- Change it on purpose. When a report needs an exception, decide whether it’s a one-off or a new rule, and update the guide if it’s a rule.
Mocking up the style guide
The quickest way to agree a standard is to mock up one reference page and get it signed off before building reports against it. Our dashboard wireframe best practices cover the layout decisions to settle first.