Power Query
Also called: Power Query Editor, Get & Transform, M query
Power Query is the data-preparation tool built into Power BI and Excel. It connects to a source, records each cleanup step you apply, and replays those steps on every refresh.
Also called: Power Query Editor, Get & Transform, M query
Power Query is the data-preparation tool built into Power BI and Excel. It connects to a source, records each cleanup step you apply, and replays those steps on every refresh.
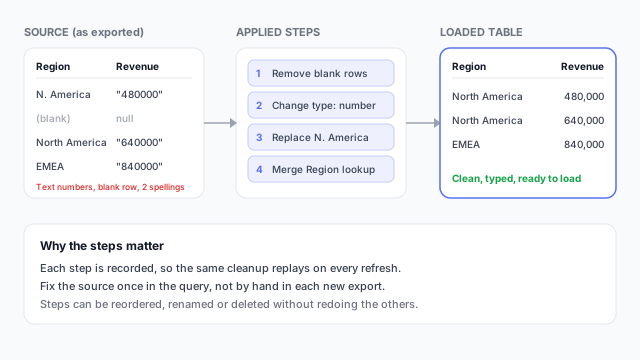
Source data is rarely ready for reporting. Numbers arrive as text, a blank row sits in the middle of an export, and North America is spelled two ways. Power Query is where you fix that, before the data reaches the semantic model.
In Power BI Desktop you open it with Transform data. You work in a grid that previews the data, apply a transformation from the ribbon, and each action is saved as a step in the Applied Steps list. In the example, four steps turn a messy export into a clean Sales table: remove blank rows, change Revenue to a number, replace “N. America” with “North America”, and merge in a region lookup.
Power Query doesn’t change the source. It saves the recipe. Next month’s export, with the same problems, goes through the same steps automatically on refresh. You can also click any earlier step to see the data at that point, rename steps, reorder them or delete one.
Behind the scenes each step is written in a language called M. You rarely need to touch it, but the Advanced Editor shows it when you do.
Both transform data, but at different points. Power Query runs when data loads; its results are stored as columns and tables. DAX runs when the report is used, so measures react to slicers and filters. A good rule is to shape data as early as possible: if it can be done in the source or Power Query, do it there.
Tableau’s counterpart is Tableau Prep, a separate tool with a visual flow of clean, join and pivot steps. Power Query lives inside Power BI and Excel, and as a list of steps rather than a flow diagram.
The columns a mockup needs are the columns worth cleaning. Settle the page design first so the query only brings in what visuals use. See why to mock up Power BI reports before you build.
Lay out your Power BI or Tableau dashboard in Mockko, get sign-off, then build. Free to start.
Try Mockko free